Facebook political ads reveal an early but limited look at the Democratic playbook
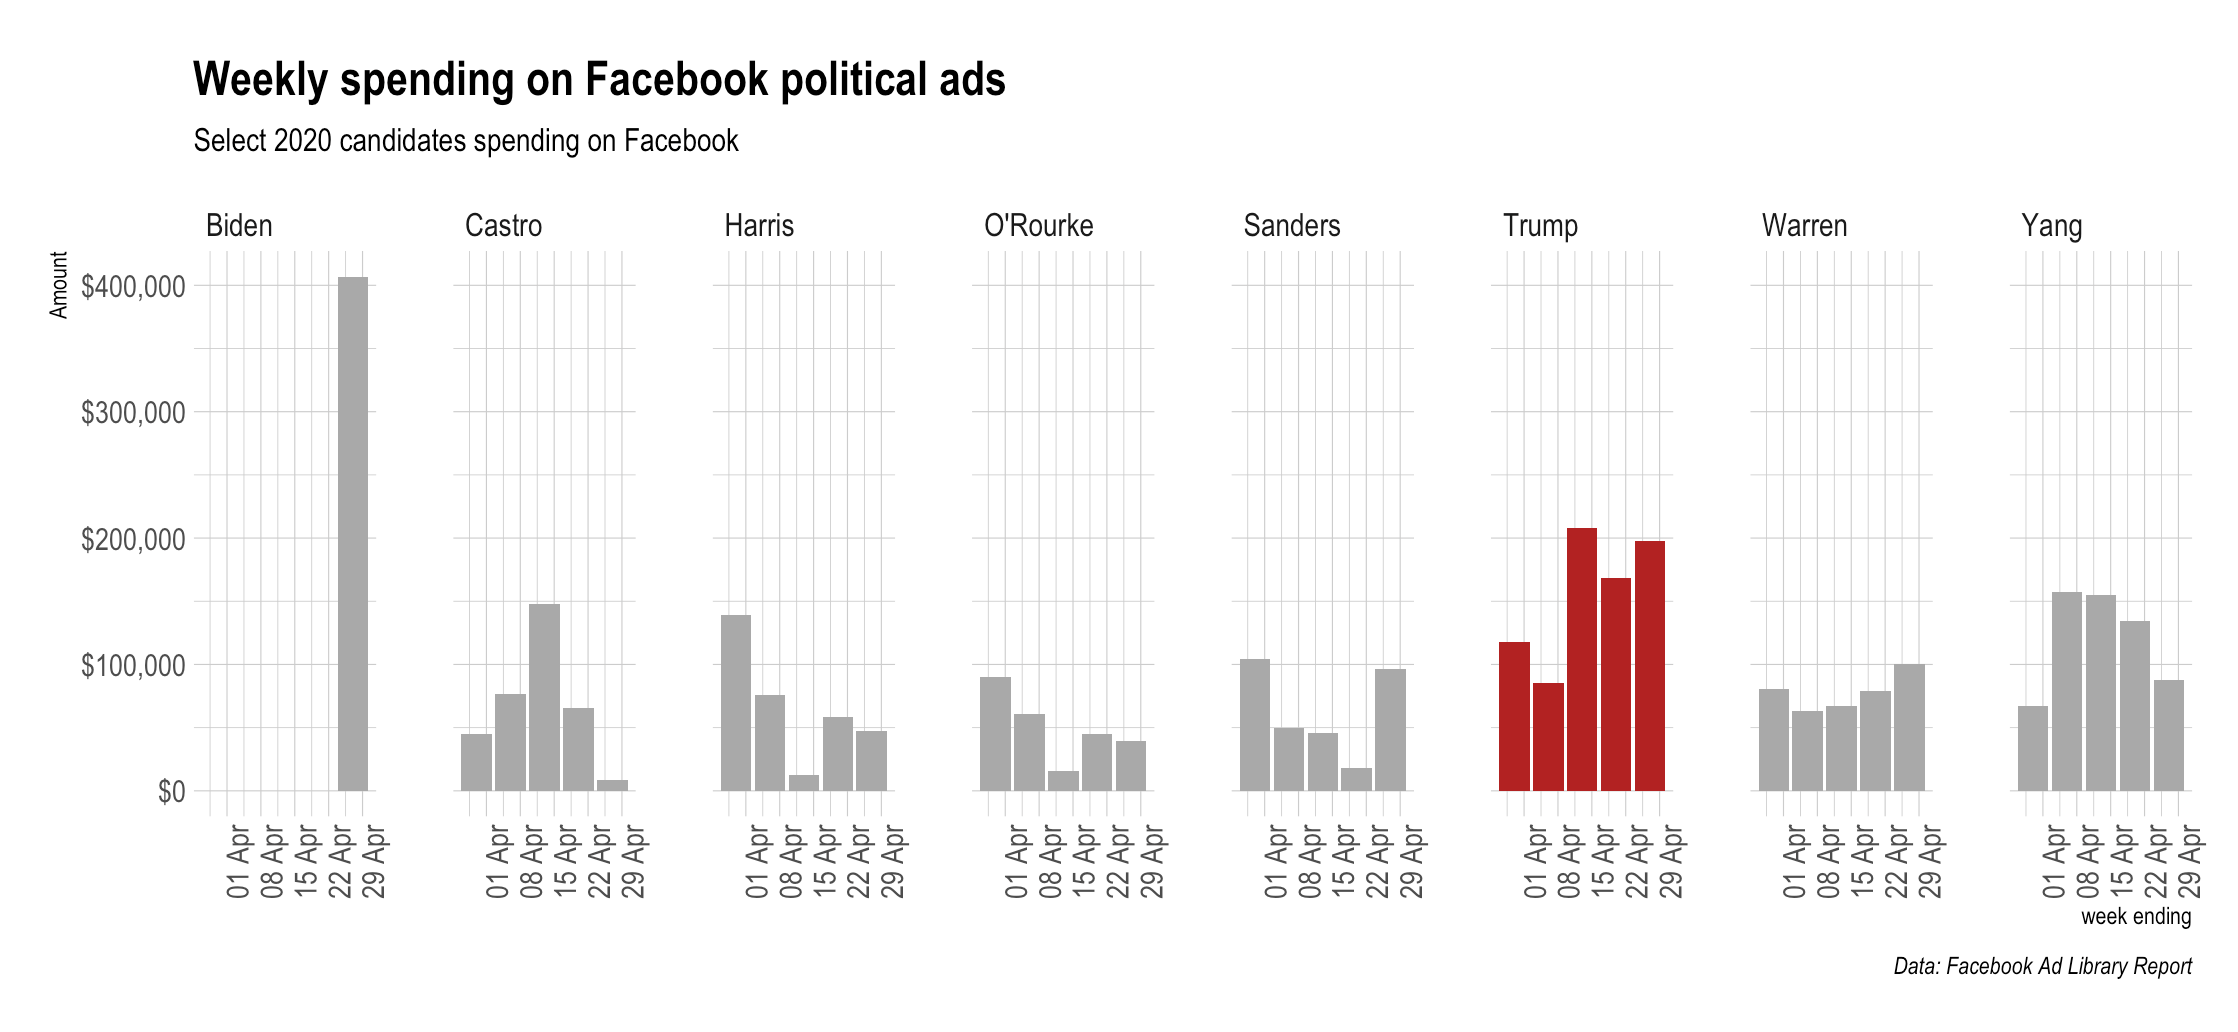
In the first three days since launching his 2020 run for president last week, Joe Biden spent more than $400,000 on Facebook ads. His fellow candidates Elizabeth Warren and Bernie Sanders, for comparison, spent around $100,000 in the last week pushing political ads onto the platform, which for both was more than they had spent the previous week. Contrast that Facebook spending with the cost of buying a TV ad in Iowa, say, which could run between $10 and $10,000 a spot.
Interestingly, over the last five weeks, according to Facebook’s Ad Library Report, 2020 Democratic presidential candidates Julián Castro, Kamala Harris, Beto O’Rourke and Andrew Yang have all been spending less on Facebook than they had earlier. President Trump, meanwhile, has ramped up his Facebook ads.
So where are these Facebook ads appearing?
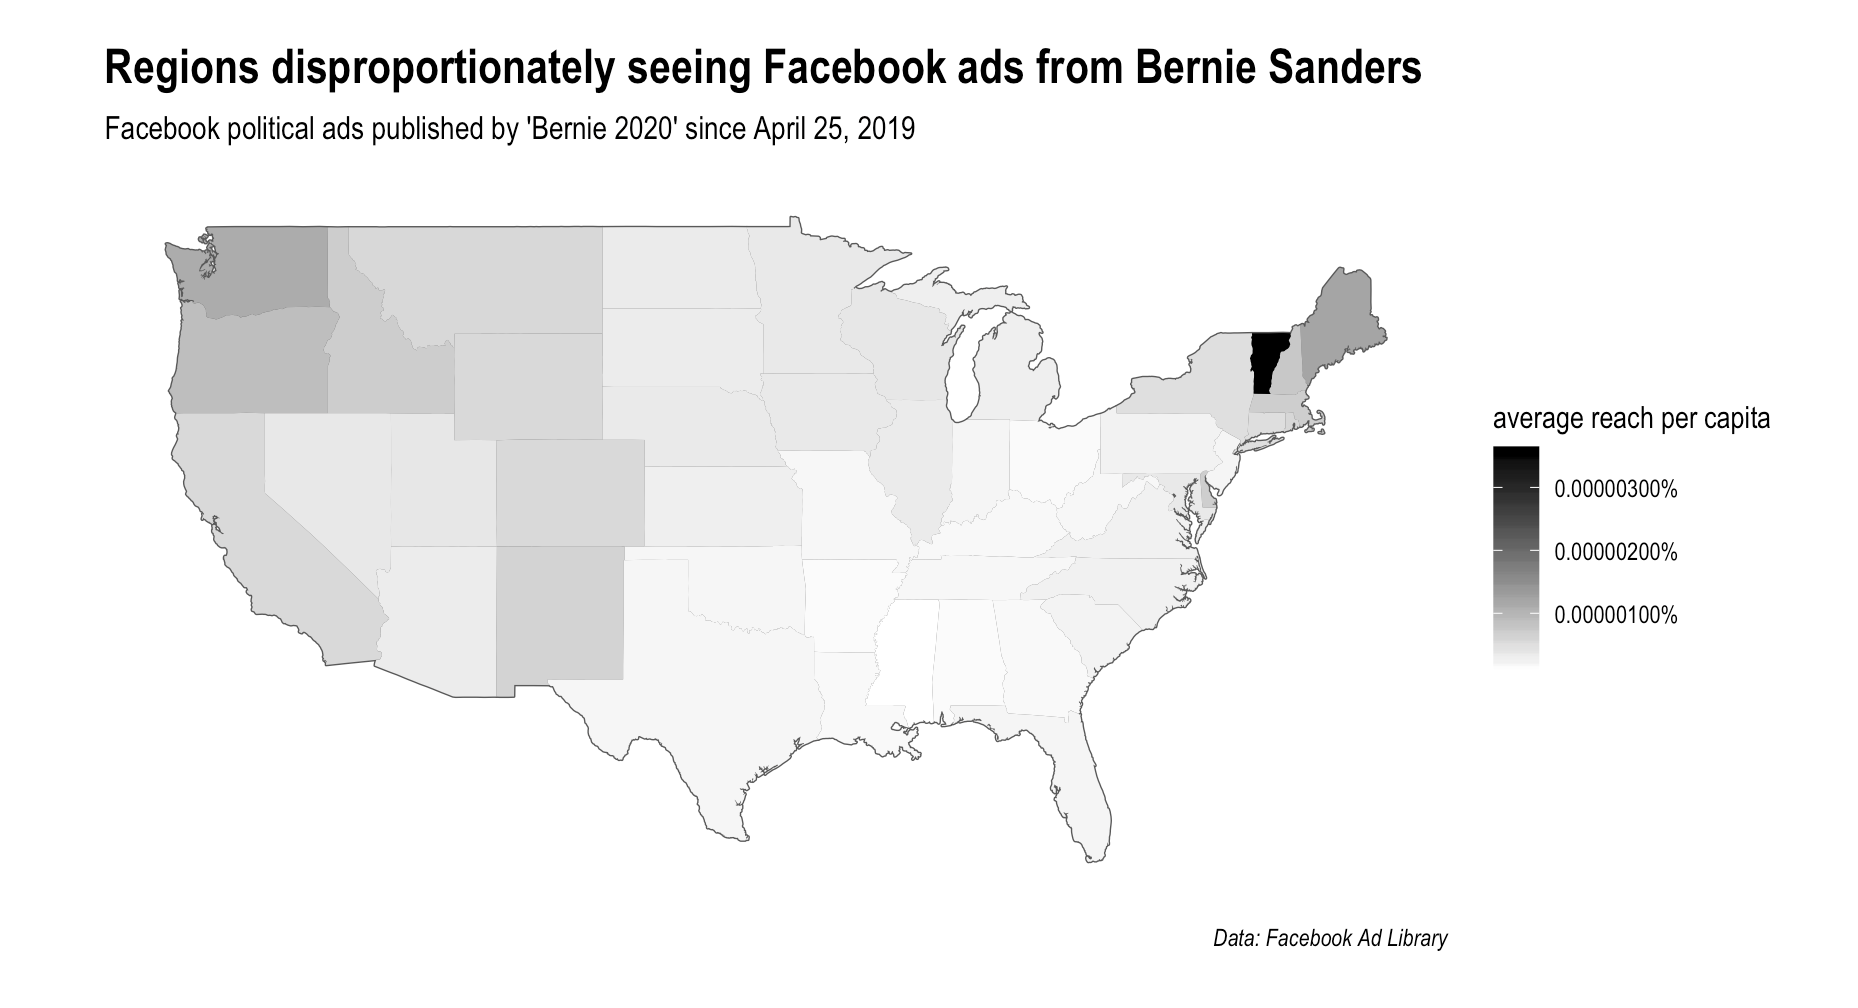
Using data from the recently opened Facebook Ad Library API, we found some interesting, albeit very early, patterns that reflect the Democratic playbook for courting donors – Biden running more ads in New Hampshire and Delaware per capita than other states; Warren flooding South Carolina; Sanders making a hard run at New England and the Pacific Northwest. As a start, we’ve only looked at those three candidates.

To be sure, the Facebook Ad Library is limited in the granularity of the data it is releasing, a problem that was criticized by the Mozilla Foundation this week. But even with only state-level exposure estimates, the ads database can still offer insights into the race for 2020.
First, a look at where Biden, Sanders and Warren are running Facebook ads on the whole, in terms of volume.
For all the ads they list – which, sadly, lack a unique ID for each ad, making them hard to track – the Facebook Ad Library includes only “region” and “percentage” data, defined as the “regional distribution of people reached by the ad as a percentage and where regions are at a sub-country level.” That means mapping sheer volume data in essence will only show a population map.
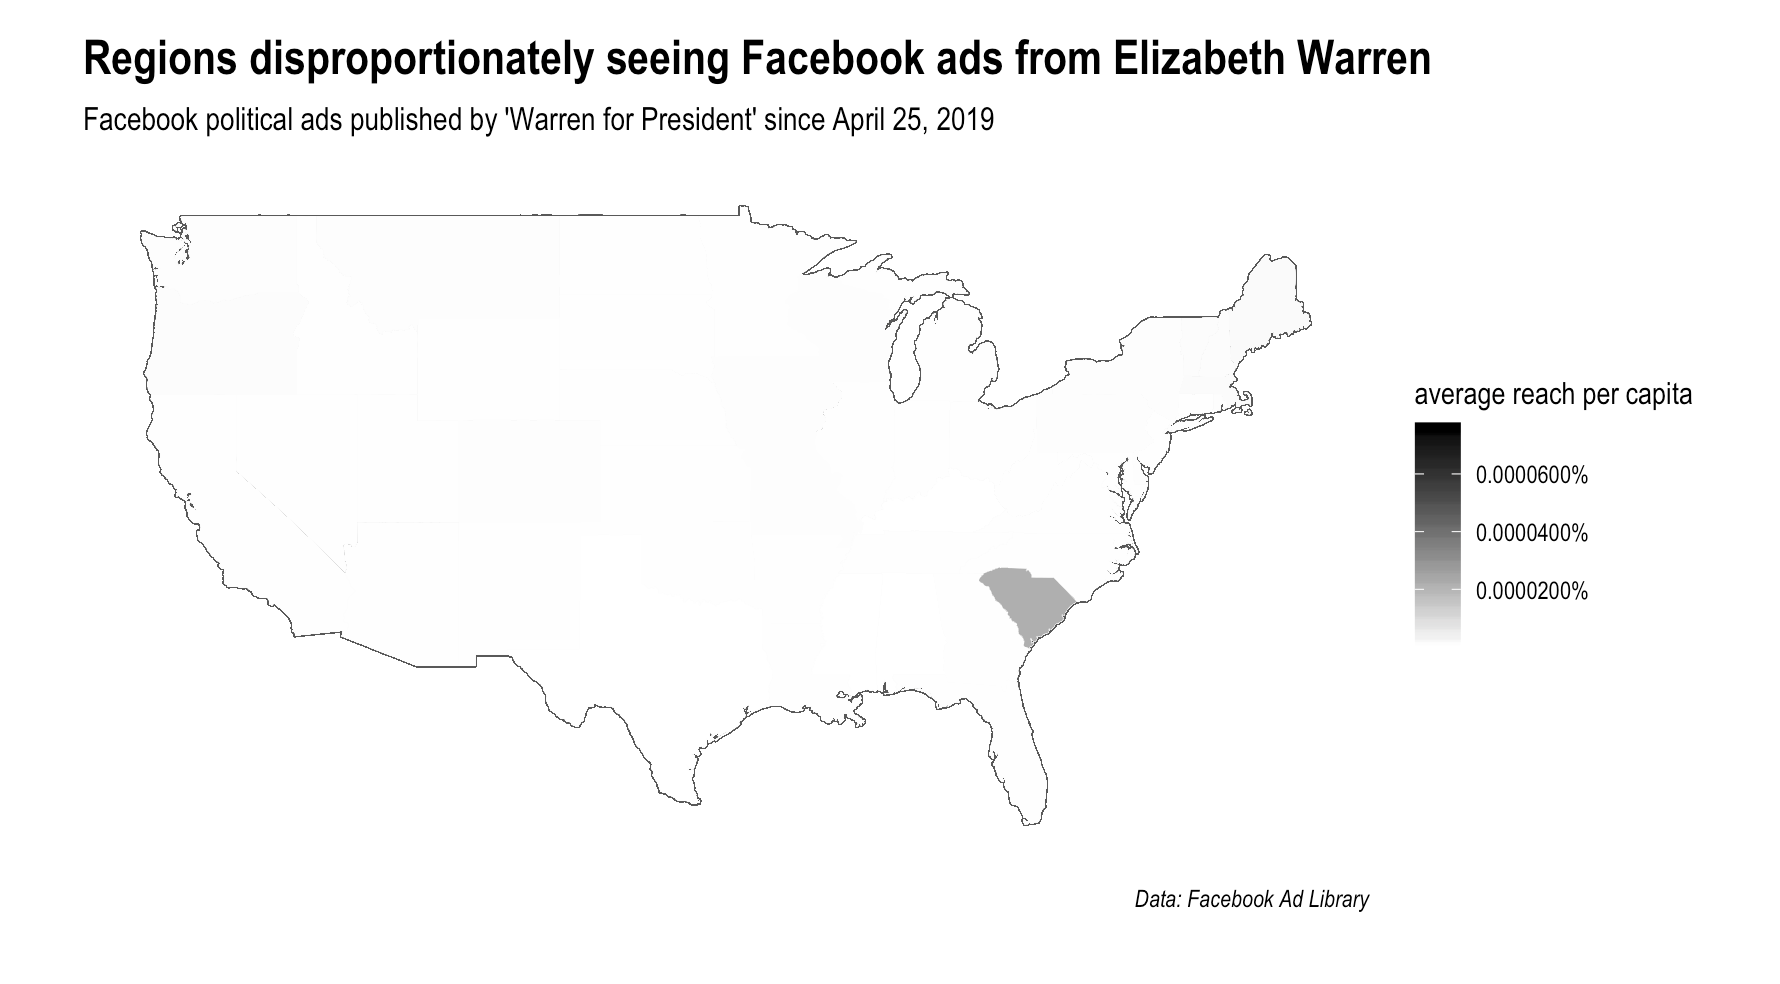
That’s no surprise, though it’s worth noting that California’s early mail-in voting is a huge wild card in this primary cycle, and Facebook ads there might indicate that candidates don’t want to ignore the state. Still, though the Democratic candidates cannot forgo spending in large states like California, Texas and New York, it’s the average reach per capita that reveals some strategies directly out of the campaign playbook.
See Biden’s per capita map:

Seeing a lot of ads per capita in Delaware, Biden’s home state, makes sense. As does his broad-based strategy covering the map to recruit donors. Montana is an interesting outlier, though.
Sanders is likewise flooding his home state while also trying to corner both New England and the Pacific Northwest.
Finally, looking at Warren’s strategy shows a fascination with South Carolina. Possible theories: 1) it’s an early primary state, fourth behind Iowa, New Hampshire and Nevada; 2) it’s part of Warren’s strategy to win over African-American voters; 3) it’s where her three new South Carolina staffers are advising her to invest; or, but most likely and, 4) it’s where she wants to leave a wake of digital ads after speaking gigs.
These data, as we said, are early.
And they should be taken with a grain of salt in terms of their proportion of overall political spending, says Jordan Lieberman, general manager of politics and public affairs at a4 Media, a “audience-based, multiscreen” advertising company.
“[Facebook] is only a small portion of political digital spending,” Lieberman says. “The per capita calculations do not take into account the universe of Democratic primary voters, which are the core audience for any of these candidates.”
Indeed, according to the “2018 Political Digital Advertising Report” from Tech for Campaigns, digital advertising only makes up a fraction of total ad spend. “Only 2.7 – 5.1% of total campaign and PAC budgets went to digital ads, while closer to 50% went to television and direct mail,” the report says. In other words, “for every $1 a donor gave, about $0.03 to $0.05 went to digital media.”
Still, Facebook ads are cheap. Those digital ad buys may not amount to much spending, but that doesn’t mean there isn’t a lot of it and we here at the Storybench 2020 Election Coverage Tracker will keep looking at the Facebook Ad Library as well as other datasets to understand what and where other sections of the 2020 campaign playbook are unfolding.