How PRI’s The World conveyed the death toll of mass shootings using sound
Last November, following two of the deadliest mass shootings in American history, PRI’s The World produced a special on global gun culture titled “How other countries can help us understand America’s mass shooting crisis.”
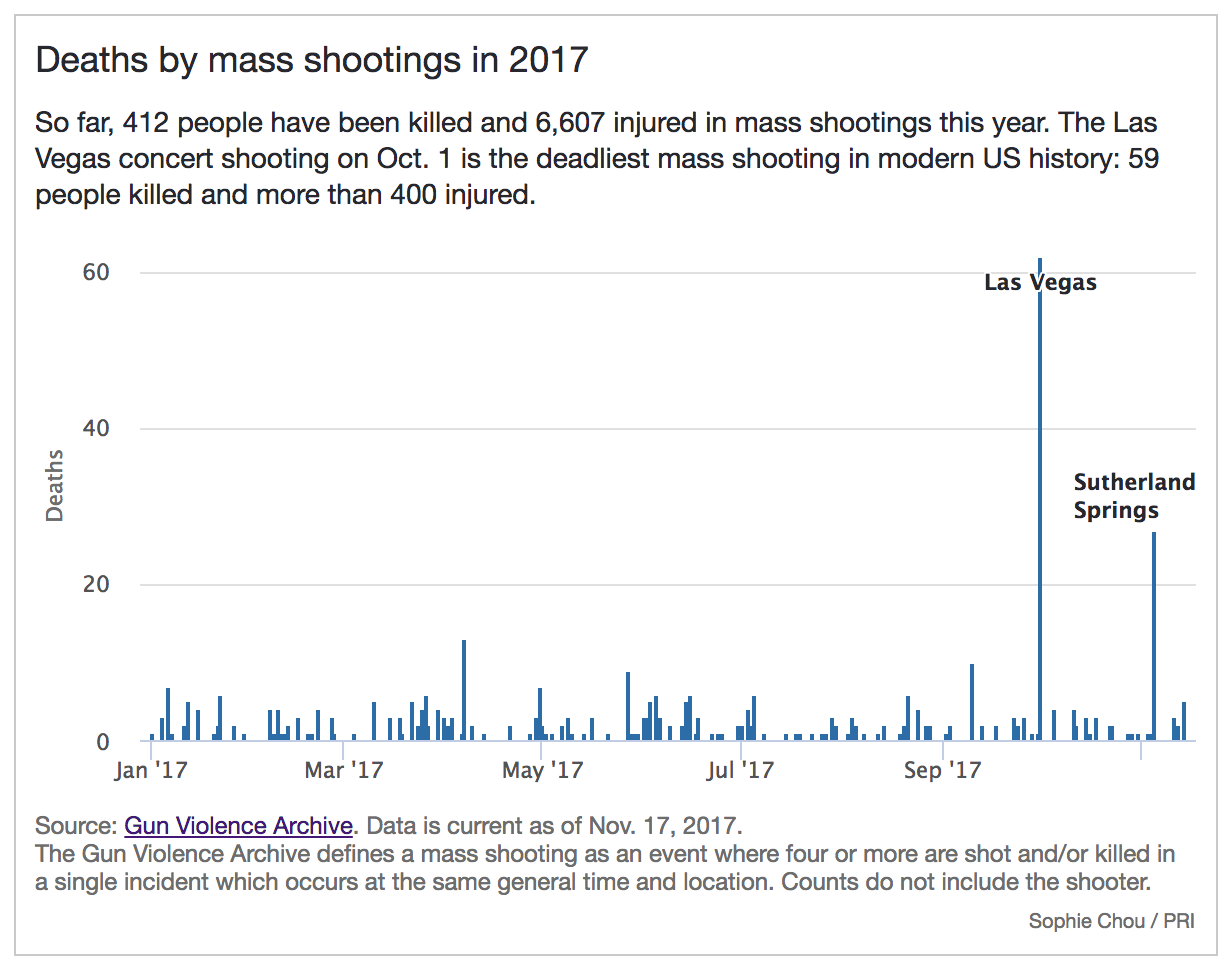
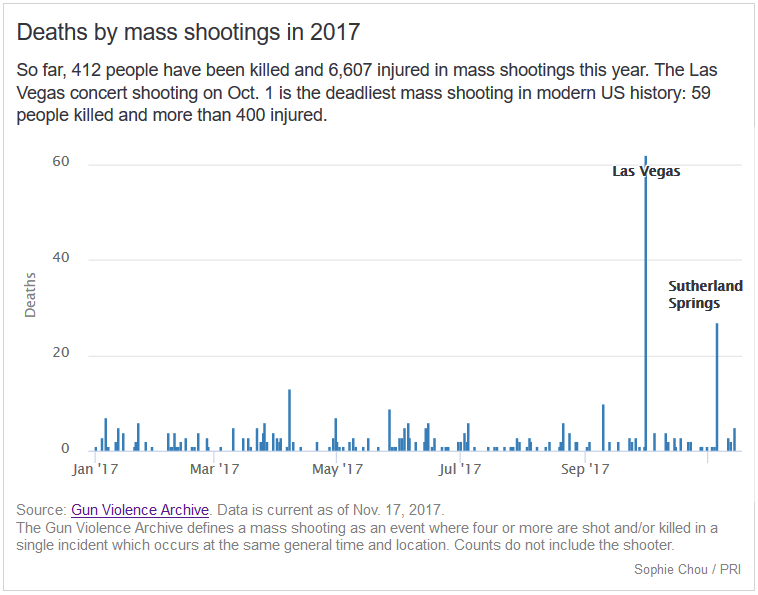
To illustrate the death toll from a year of mass shootings for the radio program, data journalist Sophie Chou used data sonification, a process that conveys data as audio. Chou translated each mass shooting that had occurred in 2017 into a note, with the volume proportional to the number of deaths. The result was a powerful way to hear data, which sometimes can convey more emotional impact than a chart.
Last week, to include the Parkland, Florida shooting, Chou updated the data sonification:
Chou spoke with Storybench about how she sonified the data and the nuances of presenting data for radio.
How did you get the idea to sonify data on mass shootings?
“I wrote extra code and processed the data I got from the Gun Archive to translate the data to louder and softer notes.”
Basically I have just been interested in exploring data in different ways and I currently work for a radio program. Reveal at the Center for Investigative Reporting has done really great work on data sonification, they also happen to open source their tools for doing this. So i just worked off that for inspiration and used a lot of their tools. A lot of their tools I built on top of.
I understand you used the Python MIDITime library from Reveal for this project. How did you tweak it for this dataset?
A library is just a library. You can do what you want with it. It’s a wrapper that lets you convert data to sound. You can adjust the variables you think will really convey the information the best. In my case, what I thought would be the most meaningful was to use the volume: how loud it is to convey meaning. I wrote extra code and processed the data I got from the Gun Archive to translate the data to louder and softer notes.
How did you decide to use volume over other possible characteristics?
With a lot of tinkering. I started off just trying to learn how to use the library. I started off trying to sonify different data sources. I tried to look at how many refugees there were around the world flowing back and forth. And when there was the Las Vegas shooting, I thought, ‘Oh this would be a meaningful thing to work on.’
At first, instead of how loud, I thought about what if I used a scale or the length of a beat. There was a lot of talk around what would be most appropriate – we wouldn’t want a tune for this type of violence. I ended up just doing volume because it sounded the most clear and appropriate and respectful.
You also made two bar charts for the online story. What’s the relationship between the charts and the data sonification?
The whole motivation for me is to try to translate data to different mediums. You know some people will listen to the radio show, and some will go online and read the story, and some will do both. So that was the exact same data, just charted. That way if someone was listening to it, they could look at the chart to see specific numbers.
Why did you use data from the Gun Violence Archive? I understand there’s other datasets available, such as from the CDC.
That’s a great question. One of the things that’s quite tricky is studying gun violence is quite limited. So I had to look at the Gun Violence Archive, which is a non-profit source. I went to that one because they were the most clear about what the data was, and they were pretty transparent about what the data meant.
In the online charts you have descriptions or footnotes about how Archive defines mass shootings and such. How can you provide this context in radio?
You can’t have as much nuance, but we try to first always tell people, “Read this piece online.” And you know the piece I ended up doing for radio was pretty transparent. I said I took the data from this place and then I did this – so I walked the listener through it.
What are some takeaways from doing data sonification versus data visualization?
I do a lot more dataviz than I do sonification, just because most of the time I’m writing instead of doing radio pieces. I found the thing that popped out the most is that sonification may have more of a emotional impact. You hear it and it sticks with you. But it’s hard to rewind and find that place. A chart: a person can really dig in, they can hover, see what it means. You can get the nuance that with sound you can’t.