Mapping the geography of racism: Why deep dives in data matter
Drawing from the work of “Mapping Inequality,” a ProPublica investigative report published earlier this month uncovered a phenomenon similar to redlining in the car insurance industry today. The report found insurers charged premiums that were up to 30 percent higher in minority neighborhoods than in predominantly white neighborhoods with similar rates of accident risk.
“As rates have been increased in the inner city, they have substantially decreased in essentially white areas,” Millard D. Robbins Jr., the head of the Insurance Brokers Association of Chicago, explained. “This creates a surtax on blackness and a discount for being Caucasian.”
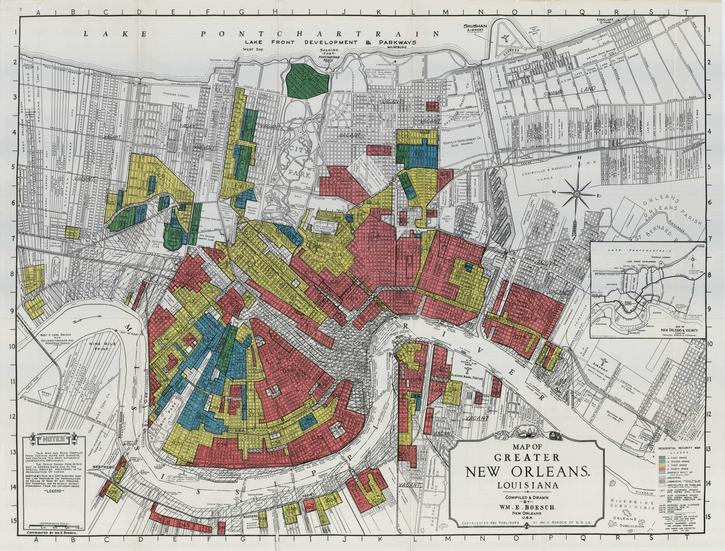
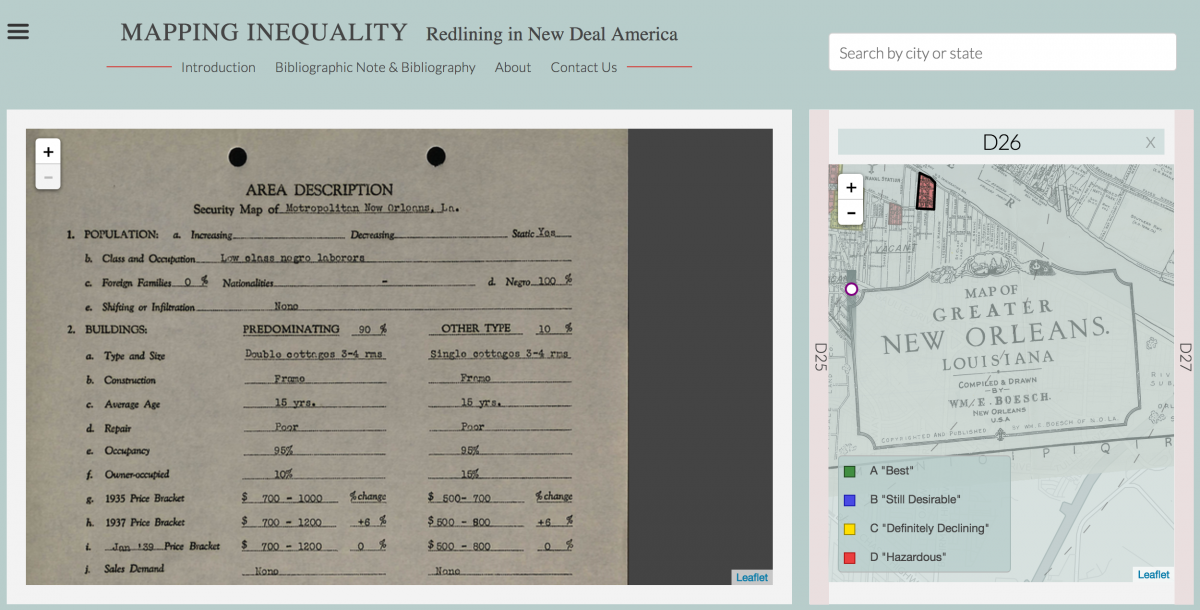
This may not look like a “digital humanities” project but it actually has deep roots in the methodologies, impulses, theories, technologies, data analysis and social justice purposes motivating much digital humanities. “Mapping Inequality” — an on-going initiative providing digital access to redlining maps made during the New Deal that legally enshrined housing segregation throughout the United States — illustrates the social justice capacities for digital humanities projects. Between 1935 and 1940, the Home Owners’ Loan Corporation (HOLC)—a New Deal federal agency—collaborated with mortgage lenders, developers, and real estate appraisers to create maps that illustrated gradients of credit worthiness.
The color-coding of these maps directly correlated with the skin color of neighborhood residents; blackness was equated with risky investment and the “contagion” of falling property values. “Mapping Inequality” makes these “security maps” of over 150 cities publicly available, providing easy access to evidence of federal government involvement in drawing the color lines that have helped dictate unequal access to wealth and resources throughout the 20th century.
These kinds of deep dives into the stories data tells take time and teams. From a 1999 poster exhibit at a conference to a collaboration between three teams at four universities today, “Mapping Inequality” has developed from a complicated network of scholars and students. Humanities, Arts, Science, and Technology Alliance and Collaboratory (HASTAC) board member Richard Marciano, LaDale Winling, Nathan Connolly, and Robert K. Nelson have led the project with teams at the University of Maryland, the University of Richmond and Virginia Tech. The work of “Mapping Inequality” also grew from the work of HASTAC co-founders, David Goldberg and Cathy Davidson, as well as Chien-Yi Hou and Robert Calderbank, that included the T-RACEs project (Testbed for the Redlining Archives of California’s Exclusionary Spaces) and an NSF grant, Cyberinfrastructure for Billions of Electronic Records (CI-BER). A wide range of undergraduate and graduate students, scholars, artists and archivists from across the country have taken part in these time-intensive projects to make the archives of redlining accessible for journalists, activists and academics.
In the era of alternative facts, the realities of on-going systemic racism these projects illustrate are often distorted and denied. Yet, data offers narrative scaffolding to facts that are patently obvious to those on the ground and living the real costs of racism in all its manifestations.
These projects uncover the inequality embedded in the everyday infrastructures of our lives, from the algorithms that decide the cost of our insurance premiums to the neighborhoods we live in and the quality of life accessible there. Complicated infrastructures of people, knowledge and funding are required for this work to occur—the kinds of networks those involved with “Mapping Inequality” were able to stitch together with hard work, patience and the access to resources higher education provides. Our positions in higher education are ones of privilege, even though many of us often forget this fact. Academia provides us with institutional spaces to create connections and carve out niches of our own design. In the years to come, we have the opportunity and the obligation to train the next generation of scholars how to tell stories that matter with data that illustrates the unequal foundations of our society, in the hopes of providing source material for real and sustained system change.
This post originally appeared on HASTAC.org.
- Mapping the geography of racism: Why deep dives in data matter - April 27, 2017