How The Marshall Project revealed racial disparities in “justifiable” homicides
From 1980 to 2014, roughly three percent of all homicides in America were ruled justified. But a striking disparity persists in killings involving a white person and a black male victim. In these instances, write Anna Flagg and Daniel Lathrop in a recent analysis published by The Marshall Project and The New York Times’s Upshot, killings were ruled justifiable more than eight times as often as others.
We caught up with Flagg, an interactive reporter at The Marshall Project, to talk about the methodology behind the analysis and explore its possible impact on the criminal justice system in America.
The following interview has been edited for length and clarity. It has been crossposted on Northeastern School of Journalism’s site The Docket, too.
You have degrees in math and human/computer interaction. Have you always intended on working in journalism?
No, not at all actually. I knew I wanted to combine math and art in whatever I did. But I wasn’t really sure that there was a place for me in journalism until about four years ago. I hadn’t really see a lot of people like me, people who do like data and design, so it wasn’t all that obvious to me that it was something that I could do.
Then I started to see some of the really cool data projects done by news organizations that are experimenting more with online, with design and with data. And I thought that, maybe, I could break into that a little bit. I quit my job in Silicon Valley, went freelance for a little while, and took some design courses. Then I started offering to work on freelance projects for news organizations for low pay or no pay, just as a way to break into the industry.
What drew you to The Marshall Project?
I had been following The Marshall Project since it launched and I really loved the team’s work. I was also very convinced of their necessity and their mission statement because the criminal justice system is a notoriously opaque and less-covered-than-it-should-be system.
You mentioned that your role in journalism has coincided with the increasing visibility of data visualization.
Data has always been a very important part of the reporting process, but I think it’s become more clear how important it is. It’s a way that people who are outside of the traditional definition of a journalist can contribute to journalism in concrete ways.
How did you come to know your partner on the project, Daniel?
Daniel pitched this data-heavy story to our editors at The Marshall Project and I was interested in contributing right away. He’s a really amazing reporter and is really great to work with. I’m so happy to have had the chance to work on such a compelling, good idea.
Did both of you contribute equally to the text reporting and the data analysis?
I think we had a part in both, but Daniel is definitely the primary, first author. I would definitely say this piece is his baby, which is kind of ironic, actually, because he just had a baby this week.
How would you describe the wrangling and design behind this project to someone new to code?
People often think that coding is a lot harder than it really is. But every reporter has used Excel or some spreadsheet at some point. That’s something that they’re very familiar with. What we did in this analysis is we used the scripting language R, an easy way of doing the things that Excel already does. So to me, this is actually a much easier way of doing things. If you’re analyzing a data set in Excel, you have to remember all these combinations of steps and formulas. Then you realize there was an error in one of the cells in your spreadsheet and you have to go back and recalibrate everything again, remembering how you did this, how you did that. R makes everything a lot easier because, if you need to do something again, it’s all written out for you. [For Storybench tutorials to get started in R, head here and here.]
How long did all of that manipulating in R, and writing the text piece, take you and Daniel?
“R makes everything a lot easier because, if you need to do something again, it’s all written out for you.”
Daniel had found this interesting result, the disparity in justifiable homicides between different groups of people, while working on a different project. Once he found that result, he worked more on it, he pitched, and then I got involved. I’ve worked on it for a few months now, but he definitely worked on it for longer than that.
Can you explain how you narrowed down the data entries, from 600,000 to 200,000?
Originally there were roughly 600,000 entries. We eliminated the rows for which we didn’t have enough information on the offender or the victim to do our analysis. That got us down to 400,000, and then we ended up cutting out around 200,000 additional entries that didn’t have enough information to do analysis or were killings committed by police officers, which we were not interested in for the purpose of this analysis.
Would it have made sense to include black women in the analysis as well?
I’m sure that Daniel had considered gender in his initial analysis, but he ended up focusing specifically on instances that involved a white, non-hispanic civilian a black male victim, because that was the situation that had the greatest racial disparity.
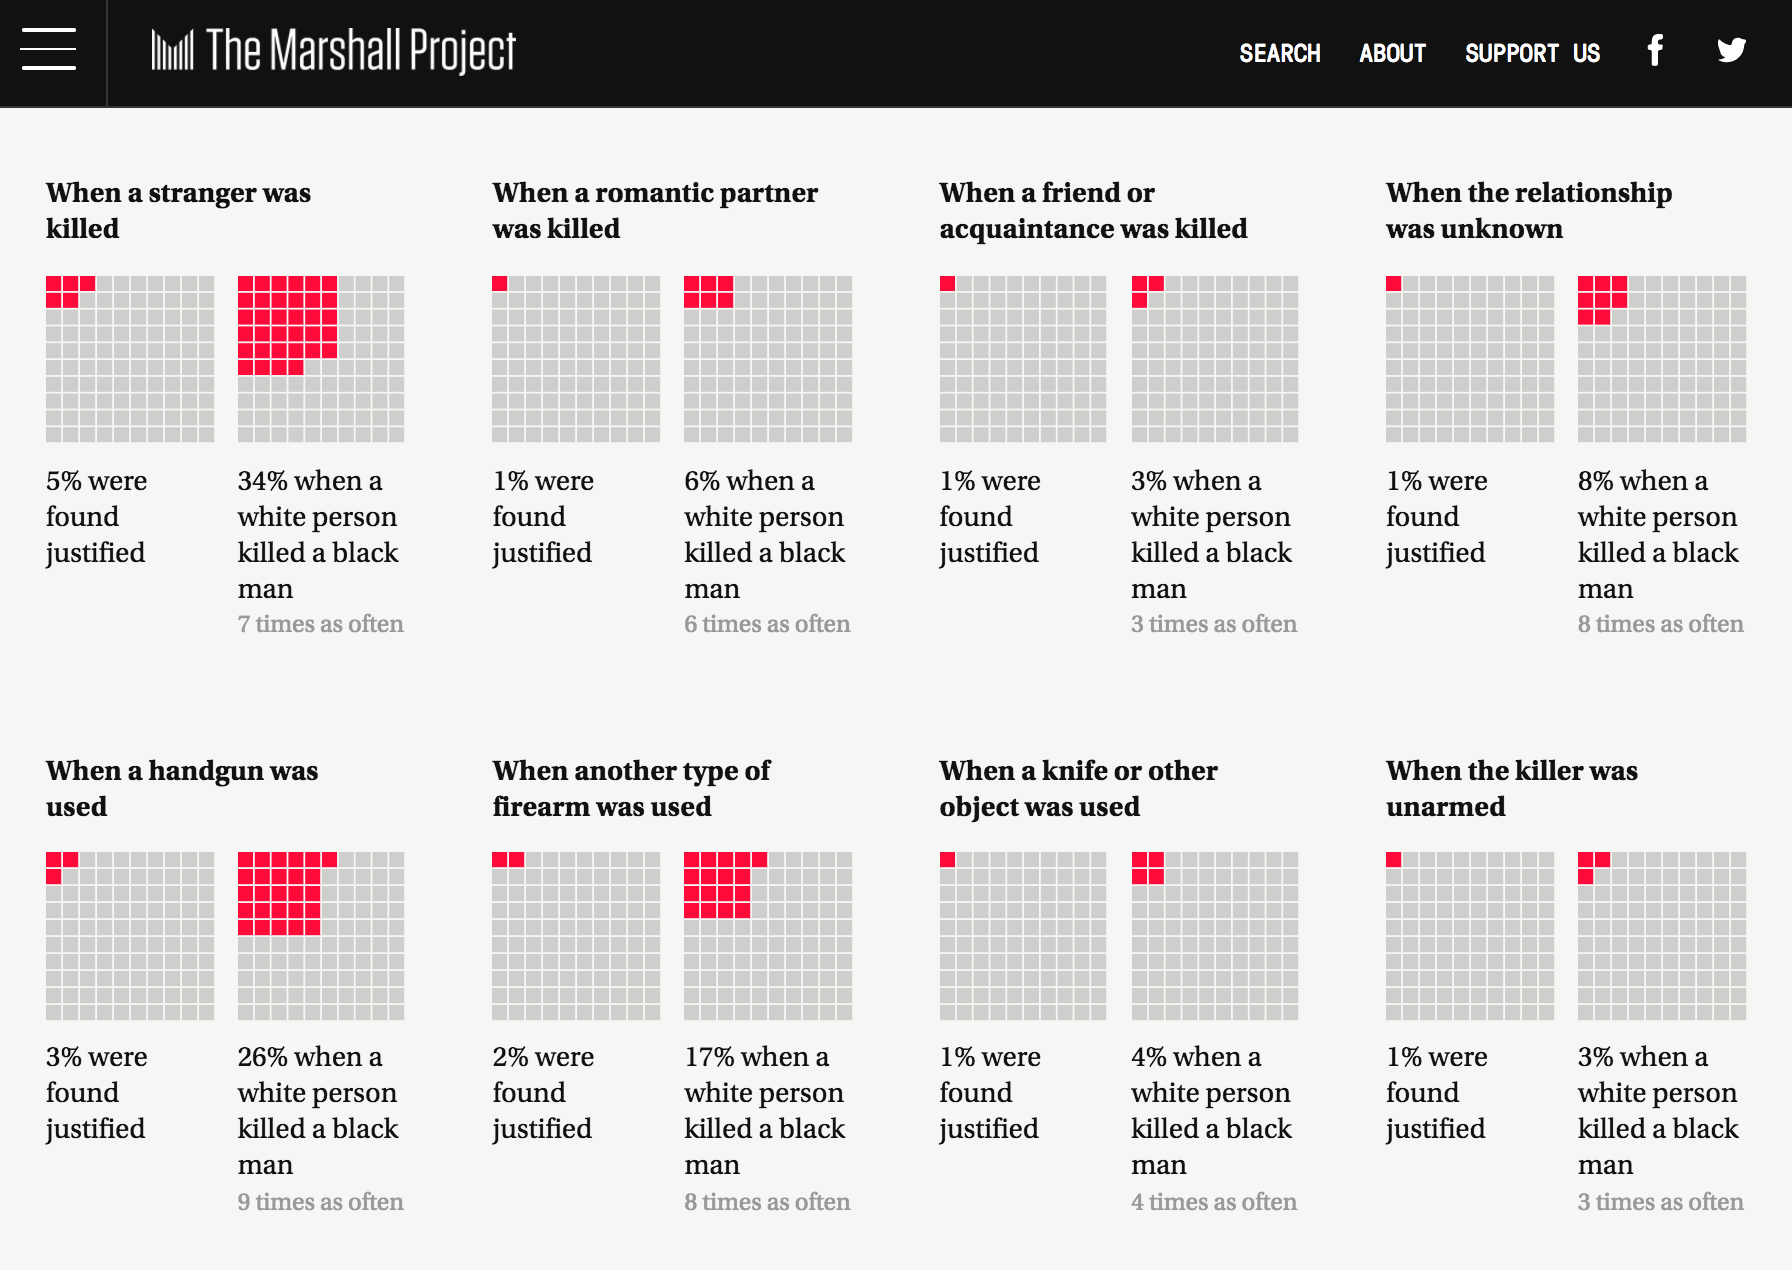
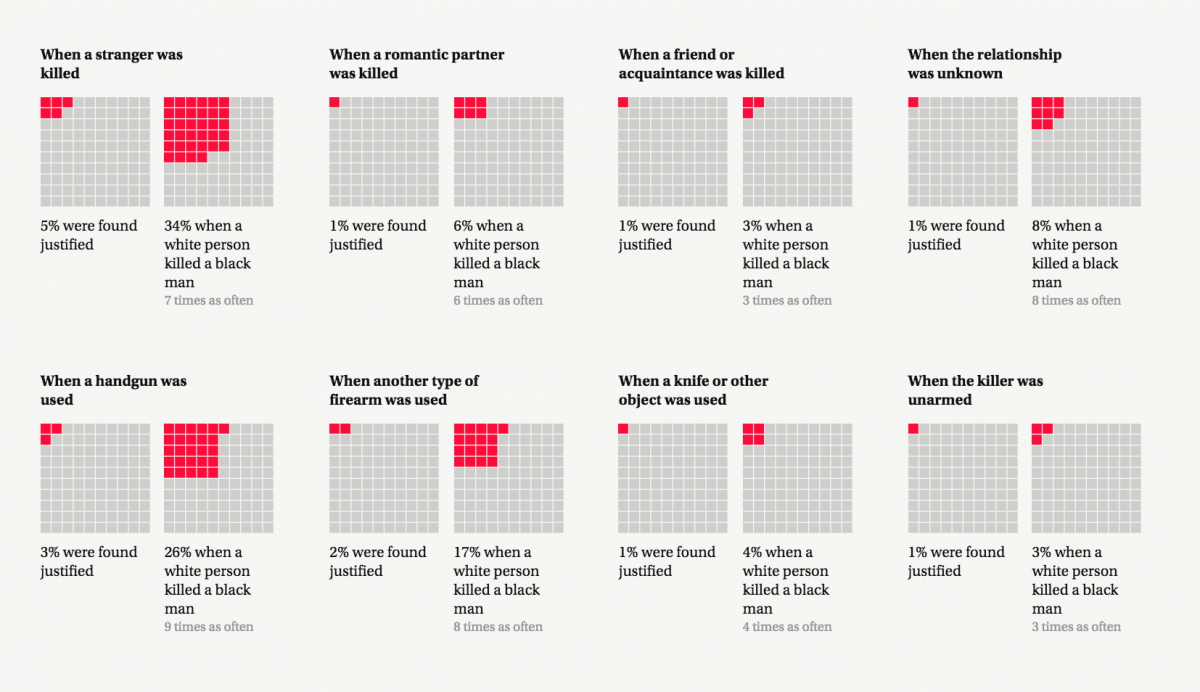
Was there a particular factor — location of police department, weapon — that you found most enlightening or surprising?
The thing that was most compelling to me was the fact that this disparity existed in every single one of the scenarios we considered. We found that, when looking at the relationship between the offender and the victim –whether they were strangers, romantic partners, friends, or acquaintances, etc. — the stranger category was the one in which there appeared to be a high disparity. Overall, five percent of killings where the victim and offender were strangers are justified. But when it’s a white person killing a black man who is a stranger, 34 percent of killings are justified. That’s a pretty significant disparity.
Do you think that the location for the incident, which was missing from the data, would provide further insight?
Oh yeah, it definitely would. I also think it would be great to know when the homicide happened. Did the killing happen during a crime that was occurring? Or was it a domestic dispute? Any additional information would help us narrow down what is really at the root of this disparity.
We discussed in the text piece that, from this data, you can’t really prove that racism, specifically, is happening. You can say there’s a difference and that it really, really seems like race is a factor, but you can’t really prove that it is causal. The more specific we can get in terms of the data, the more convincing it would be that we have found a significant racial element.
What are your personal thoughts on the terminology ‘felon,’ used to label the victims in these cases?
When I first read those labels, I thought that there was an error in the data. I was very confused about what it meant. ‘Felon killed by private citizen’ and ‘felon killed by police officer’? Who are we even talking about? Who is this ‘felon’? But when something has been ruled a justifiable homicide, that means that the person who was killed must have been committing some sort of crime, so they’re automatically labeled a felon.
The data you analyzed ended in 2014, shortly after Michael Brown. Since, according to the text piece, reform has focused largely on killings by police on the ‘felon.’ What do you think data collected after 2014 will tell us?
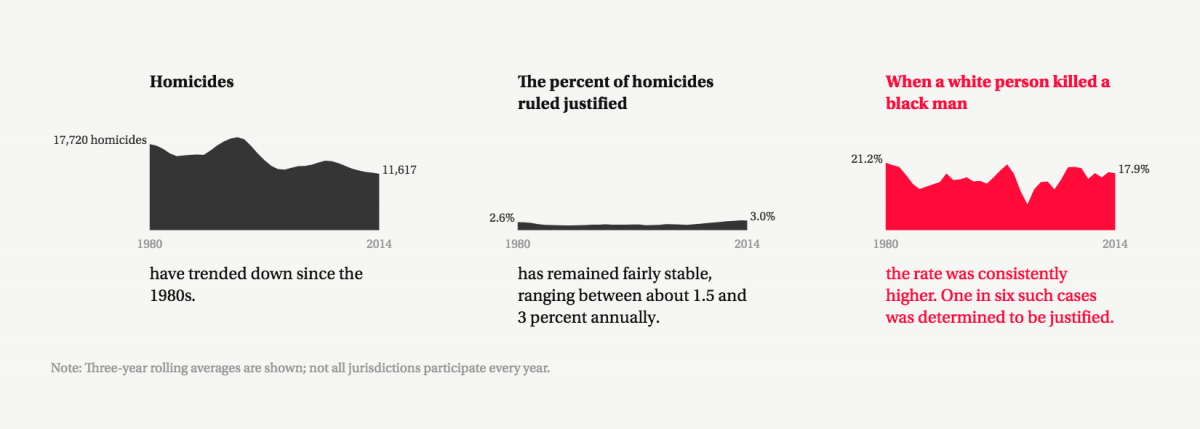
I can’t really speculate on data that we don’t have, but we did look at how this data has changed over time. What we saw is that, overall, homicides have trended down, but the percent ruled justified doesn’t appear to be changing that dramatically. And the percent ruled justified when a white man kills a black man also does not seem to be trending in any particular direction. I would expect that the current situation is similar to what we analyzed.
What are your overall feelings about how this study fits into the current climate in the country?
Charlottesville is a very clear example of obvious, violent, clear racism. What data like this shows is that, in addition to that kind of obvious, inadmissible racism, there are also all kinds of more subtle and insidious examples of racism that are built into the system in such subtle ways that we may not even know consciously that they’re there. That’s another challenge that we face and that we need to keep in mind.
Are you going to do more work with this data?
Oh, I’m sure. This is quite a big and rich data set, so we’ll keep plugging away at it.
Is there anything else that you think would be beneficial for either journalists or new consumers of this data to know?
One thing about this data is that there are a lot of gaps. This jurisdiction didn’t report for ten years for some reason, or that jurisdiction didn’t report any kind of ethnicity data for however many years. That, in addition to the fact that specific information about recorded homicides is often not available, makes the picture very unclear. Better and more complete data collection is really crucial.
I don’t think it is a huge surprise to people that there’s racism in this part of the criminal justice system. However, unless we have the actual data to prove it, people can completely ignore it or they can say that it is just perception. It is important to have the actual data so that we can prove what is happening.