Panama Papers insights and more: Five data journalism workshops you missed in Helsinki
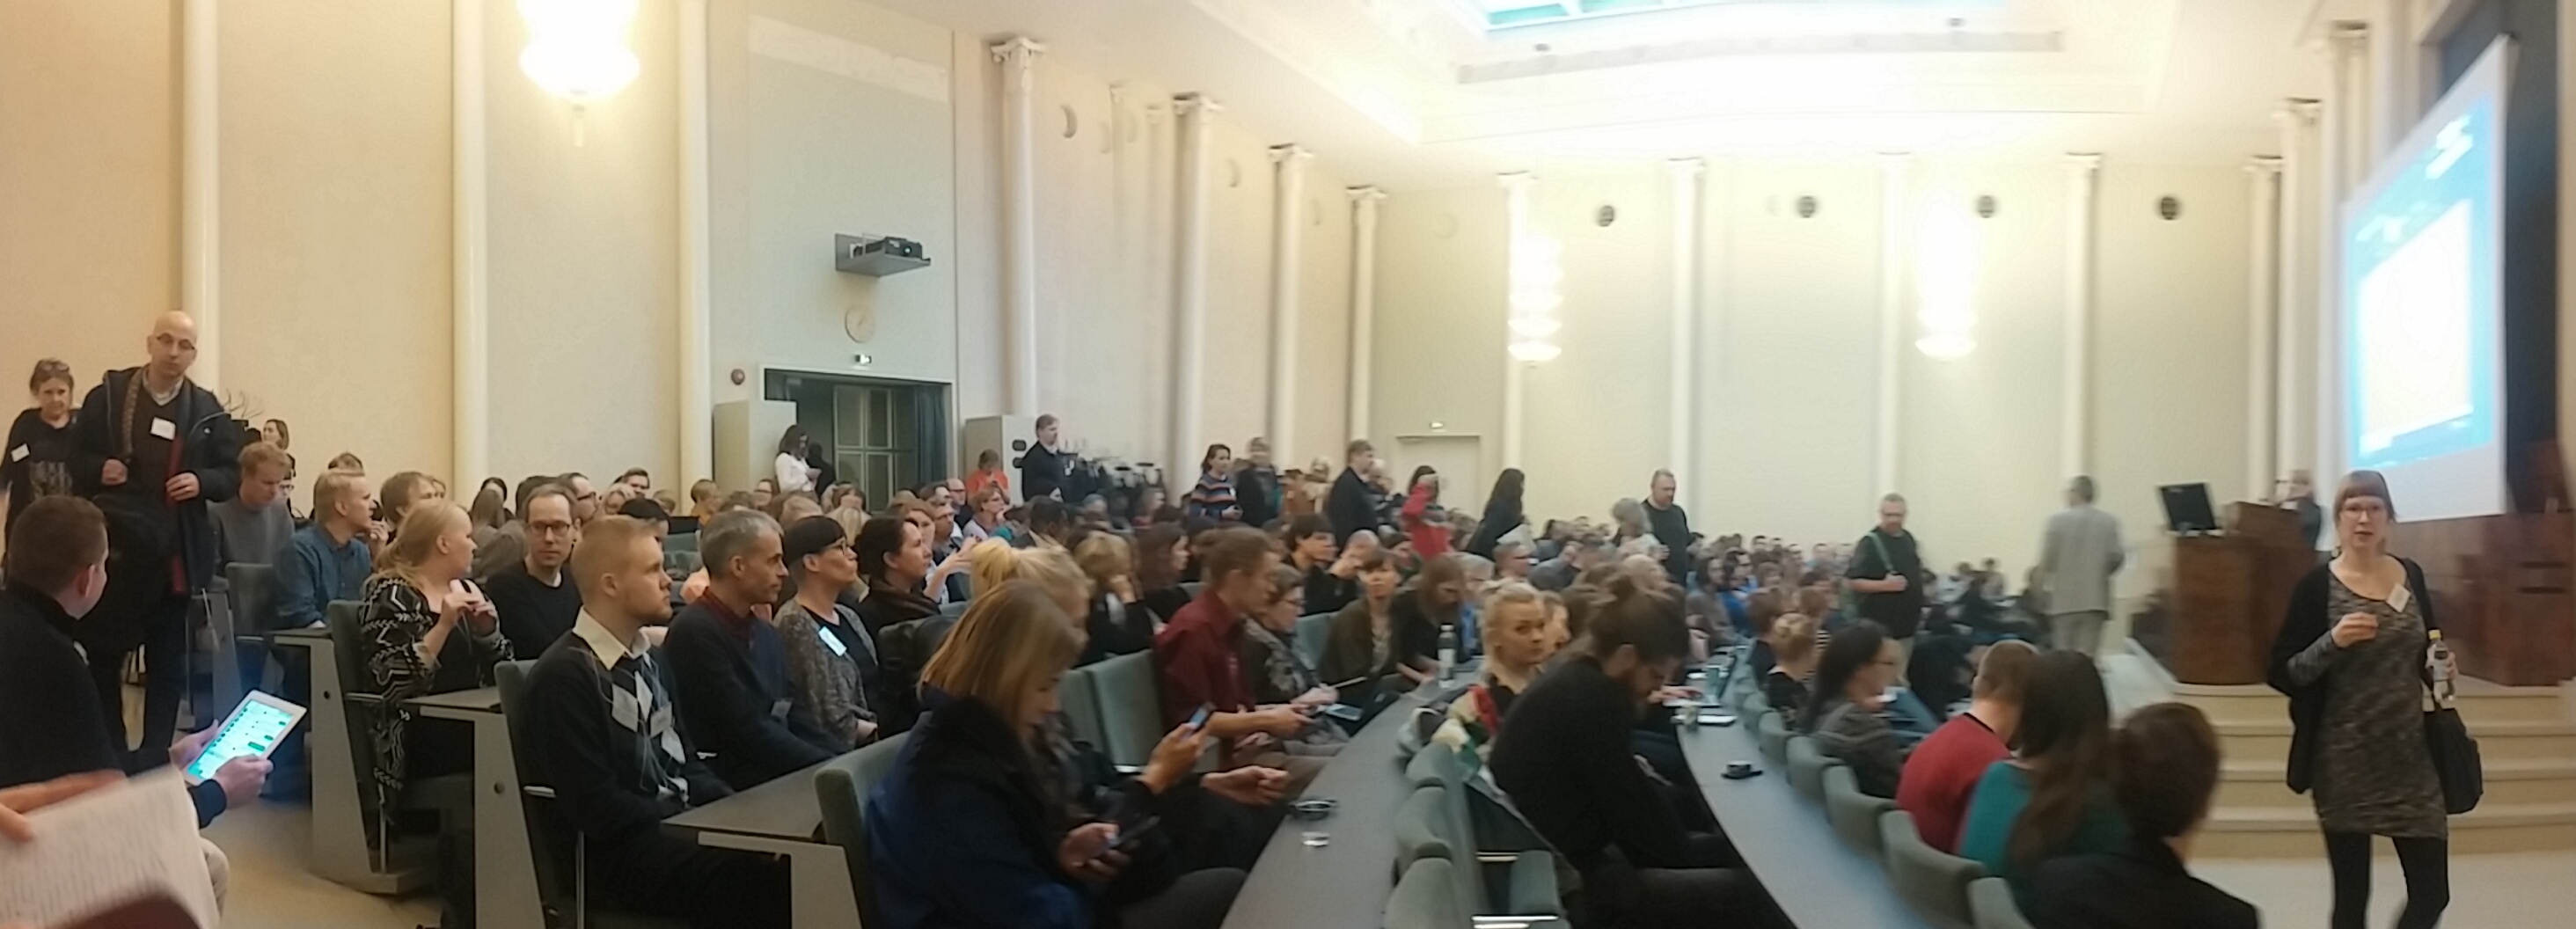
News robots, Facebook algorithms, storytelling through virtual reality, mapping data on CartoDB or Google Fusion Tables, and gaining design skills were some of the workshops that media professionals attended at the NODA and Tutki!2016, a joint conference held last weekend in Helsinki, Finland. It was organized by NxtMedia Norway and Finland’s Association for Investigative Journalism.
Data journalism experts Bastian Obermayer, Simon Rogers, Nicolas Kayser-Bril, Henk van Ess and Helena Bengtsson shared their knowledge and led discussions about the data visualization design, learning to code, and cracking the data dump that was the Panama Papers.
Below please find five workshops and keynote speeches I attended last weekend that left a mark. Presentation tip sheets from the conference can be found here.
https://vine.co/v/iFYZ9mXzM79
Protect the source – Bastian Obermayer, Reporter, Süddeutsche Zeitung
For the first time since the publication of the Panama Papers, Bastian Obermayer attended a conference to discuss the biggest leak ever of cross-border tax havens. In his speech, Obermayer said that he and his collaborators haven’t yet published all the data in an effort to protect the source and because of privacy laws in Germany. Among some of the interesting things Obermayer said:
On the New York Times: They were not left out of the Panama Papers investigation. They were not interested in collaboration.
In hindsight: If they could have done something differently, they would have included a data journalist earlier in the process to help manage all the data.
On a tip jar: Some people wanted to donate to the Panama Papers team. They couldn’t accept them and instead suggested fans buy newspapers.
The data: Some information was very new (two-days-old). They had to buy three new computers as the data grew. By the end, they had received 2.7 terabytes of data stored on computers not connected to the Internet.
"We would never receive any more data if we gave away our source" @b_obermayer can't share #panamapapers #noda16 pic.twitter.com/rVSBHWp3EB
— Carl-Gustav Lindén (@Gusse) April 23, 2016
Collaboration: This project was a team effort based on collaboration, where journalists from around the world shared information and set aside big egos. “No one goes first.”
What, why and how: put the data in context – Jan Willem Tulp, Founder, Tulp Interactive
The goal? Improve data visualization design skills and be able to critically evaluate a visual representation of data.
There are three keys to creating a good data visualization: data (what we want to tell), concept (why someone is using it) and design (how you can represent this data in a way that makes sense).
How to develop these skills? Learning by doing. A good exercise is to create alternative designs for graphics that have already been published. As Tulp said, “It’s not about saying what other people have done wrong but visualizing the information in a different and better way.”
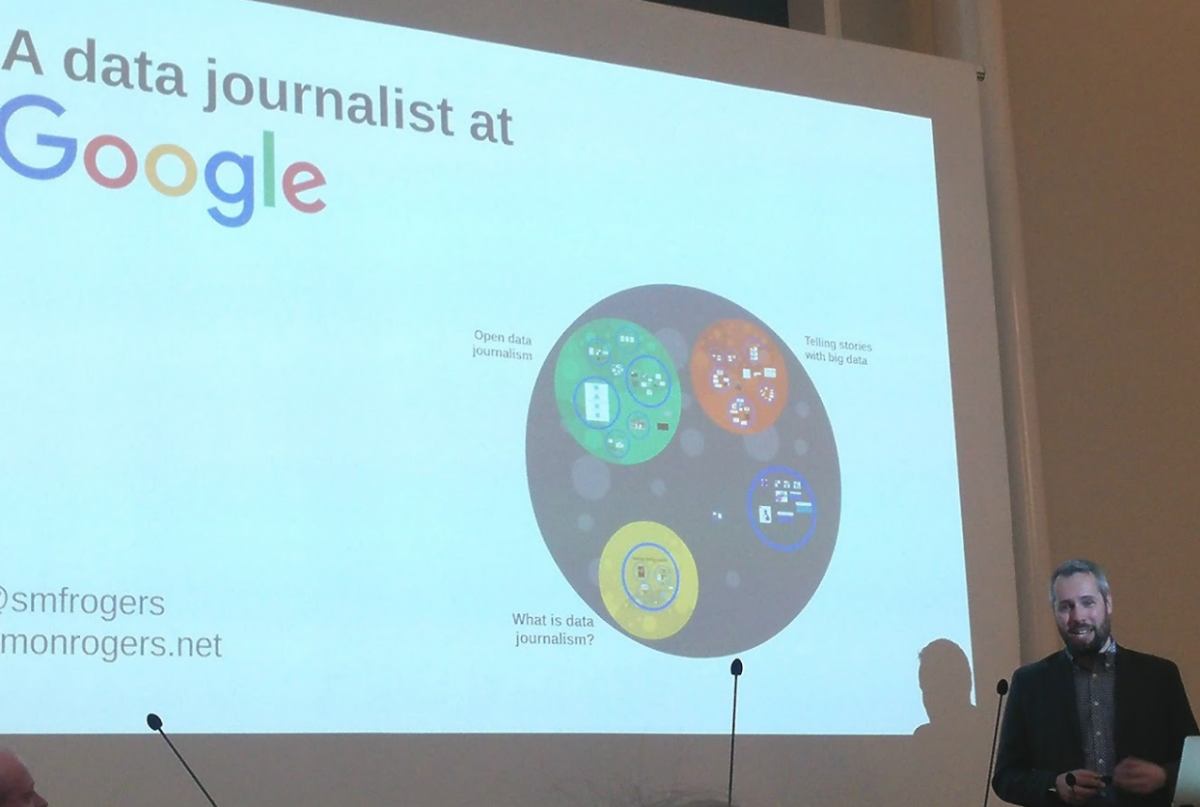
Data is everywhere – Simon Rogers, Data Editor, Google
From the Guardian, where he has also worked, to Google, Simon Rogers explained his journey in data journalism and said that everyone can be a data journalist. The most important skill is to tell stories and explain the data simply. You do not necessarily need to be the smartest person in the room. The following chart helps break down the flow.
Simon Rogers from @google (formerly @guardian) explains the steps towards a good datajournalism story. #noda16 #ddj pic.twitter.com/xPxJSGKTK0
— Hendrik Lehmann (@plateauton) April 22, 2016
What to remember: Allow the audience to explore the data themselves without telling them what to do. Ask for their feedback.
How to find what readers want? Google Trends and Google News Lab can help journalists find what audiences (really) want to know: “We are never as honest as with our search engine.”
https://twitter.com/nodatutki2016/status/723494172536254464
Bogus data does not help at all – Nicolas-Kayser Bril, Founder, Journalism++
Journalists need data to be accessible, but governments and administrations don’t always have the same goals at heart. They make data available that serves their own mission. The rationale behind data collection is important to assess the quality.
This is an excellent #tutki16 talk by @nicolaskb on data context https://t.co/o6iG4ajQ7K #noda16 pic.twitter.com/xNb38Mxjea
— Paul Bradshaw (@paulbradshaw) April 23, 2016
The co-founder and CEO of Journalism++, a data-driven consulting, training and visualization agency, said that being able to access bogus data is pointless and sometimes no data is better than bad data.
What’s next? It’s time for journalists to collect independent data and create their own databases. An example is The Counted by The Guardian. Their methodology was later adopted by the FBI.
Robots will not take our jobs – Jens Finnäs, Founder, Journalism Stockholm
Automation can help the media to build stories and share them in social media platforms. For instance, Reuters is already using automation to analyze its polling data.
The code and the result: @jensfinnas demonstrates #robotjournalism at #tutki16 #noda16 pic.twitter.com/GwPWRVJ0Wm
— Paul Bradshaw (@paulbradshaw) April 23, 2016
Who can take advantage of this? Hyperlocal news is the perfect opportunity for automation to generate text and find stories.
Will robots take our jobs? No. Journalists still need to do some research, find a story and write about it.
How can we start doing it? Look for some task that we do repeatedly, where our news comes from, and learn how to code. Some services Finnäs recommends for gathering data: Google Alerts, IFTTT and Visualping.
- Five chatbots created by newsrooms in 2016 that we liked - January 23, 2017
- Panama Papers insights and more: Five data journalism workshops you missed in Helsinki - April 26, 2016