Seinfeld, Big Data and measuring the Internet’s emotional landscape
“I’m out there Jerry and I’m lovin’ every minute of it!” Kramer, Jerry Seinfeld’s wacky neighbor, would roar as he walked into a scene. Kramer was also the television show’s happiest character, according to a mathematical analysis of the sitcom’s scripts conducted by Chris Danforth and Peter Dodds, University of Vermont mathematicians.
 The pair have been applying a ranking algorithm they’ve developed at UVM to rank the ‘happiness’ of words in a large dataset. Seinfeld scripts was a fun trial run. Their happiness ranking system, which they and their colleagues at UVM’s Computational Story Lab have dubbed the Hedonometer, has been used to analyze Google searches, Twitter messages, movie scripts, and song lyrics from around the world.
Their work has applications for journalists who want to tap big data for stories with more firepower.
“The goal for most good data scientists these days is developing tools to discern which stories pulled from big data are scientifically defensible,” Danforth told Storybench. “Journalists will often use an anecdotal tweet to help personalize a story. We’re hoping that our instrument can be used to quantify the bigger picture, the emotional temperature surrounding public opinion.”
Analyzing Seinfeld is a playful application of a powerful tool the mathematicians have developed to study positivity in language. Their argument is simple: the current methods for measuring mood or positivity vary widely across surveys, questionnaires, polls and other studies. Could a statistical approach using big data be a better barometer for reading cultural mood?
The Hedonometer uses an algorithm to rank the appearance, frequency, and relationship among words in a given sample. This ranking system was initially calibrated by hiring Amazon Mechanical Turk employees to score 10,000 words along a happiness ranking: “love”, “beauty” and “rainbow” score high; “ugly”, “hate” and “sick” rank low.
Once they had a calibrated Hedonometer for the English language, they began running collections of texts through it. They looked at music lyrics as a way of inferring a nation’s mood. They looked at happiness in the blogosphere, finding, for example, that Michael Jackson’s death had resulted in a three-day low in the online mood.
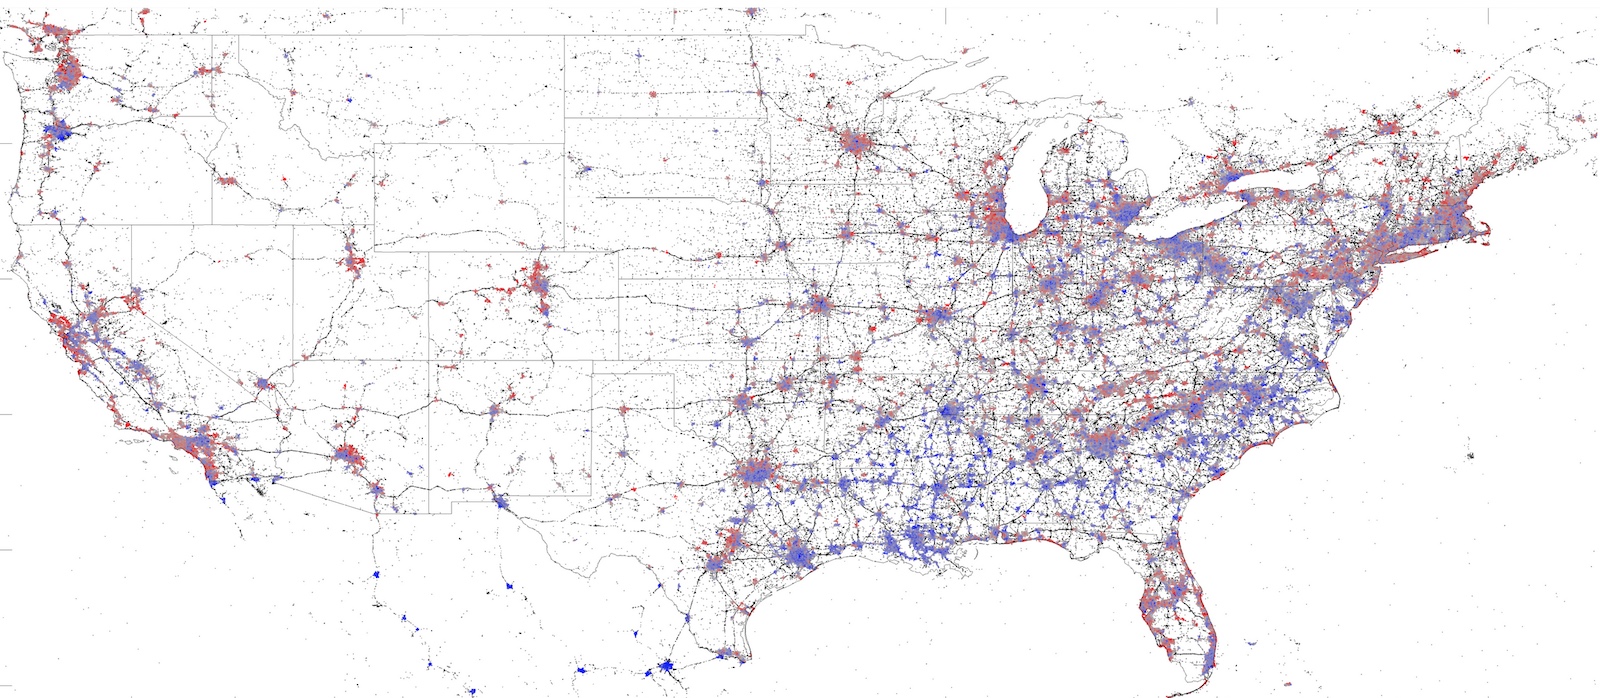
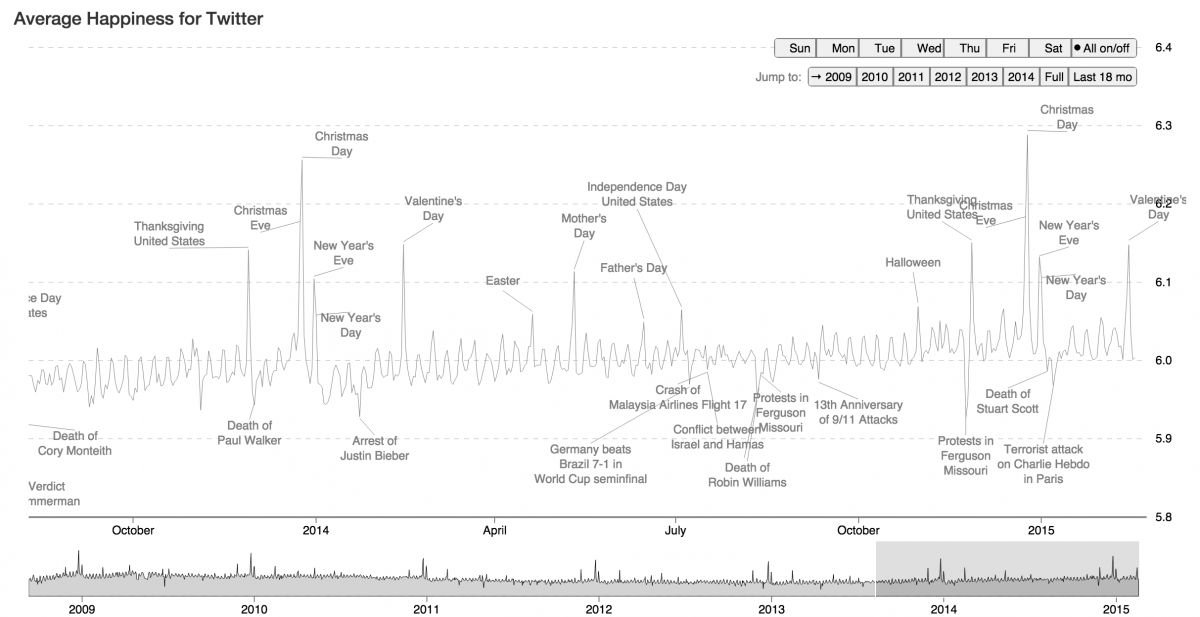
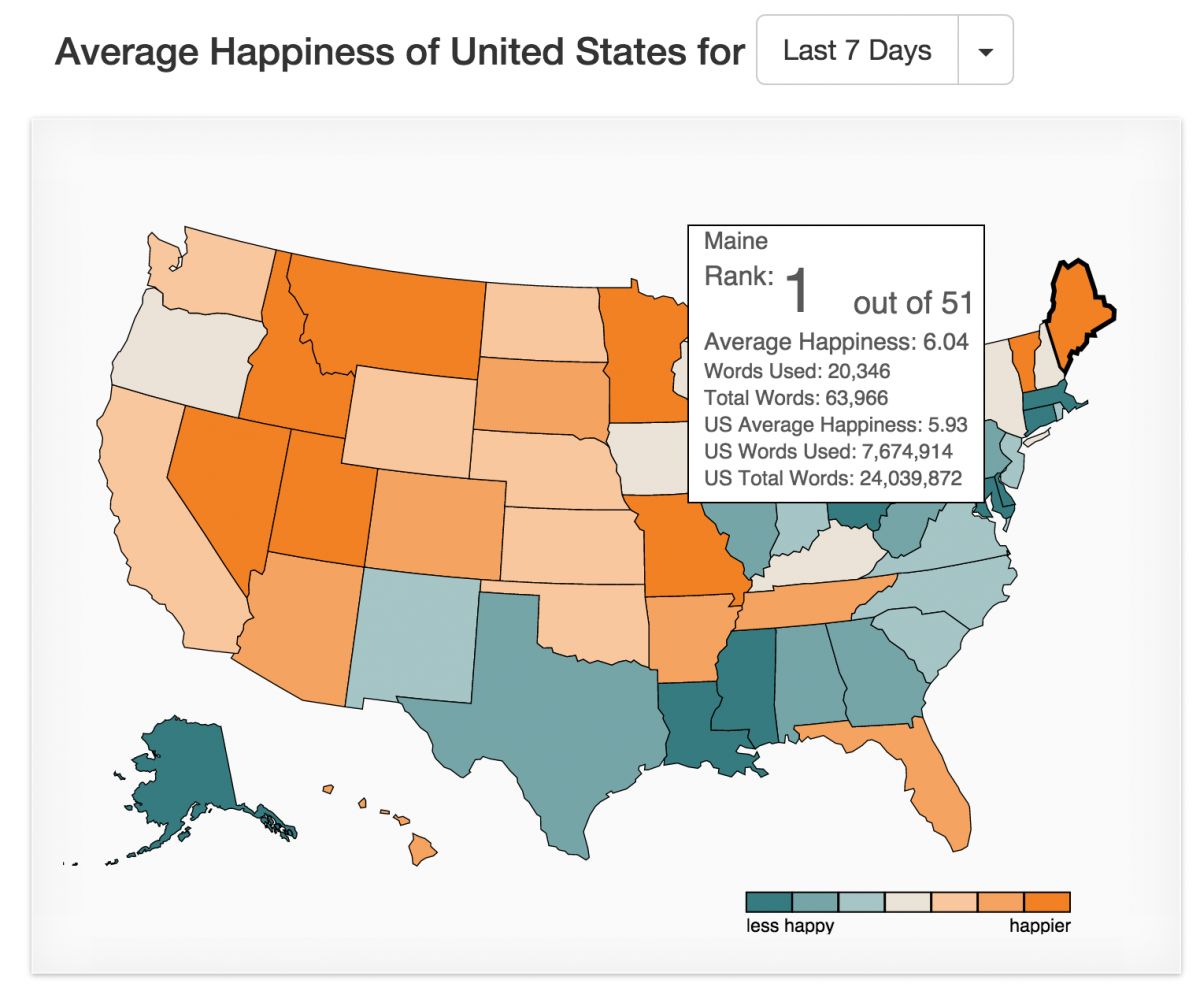
Lately, Danforth and Dodds have been researching the Twitter firehose, trying to make sense of some subset of the 500 million tweets that are sent out per day. They are currently analyzing tweets from U.S. states in real time. As of this last week, Maine is the happiest state.
Inferring a country’s happiness from its Internet searches
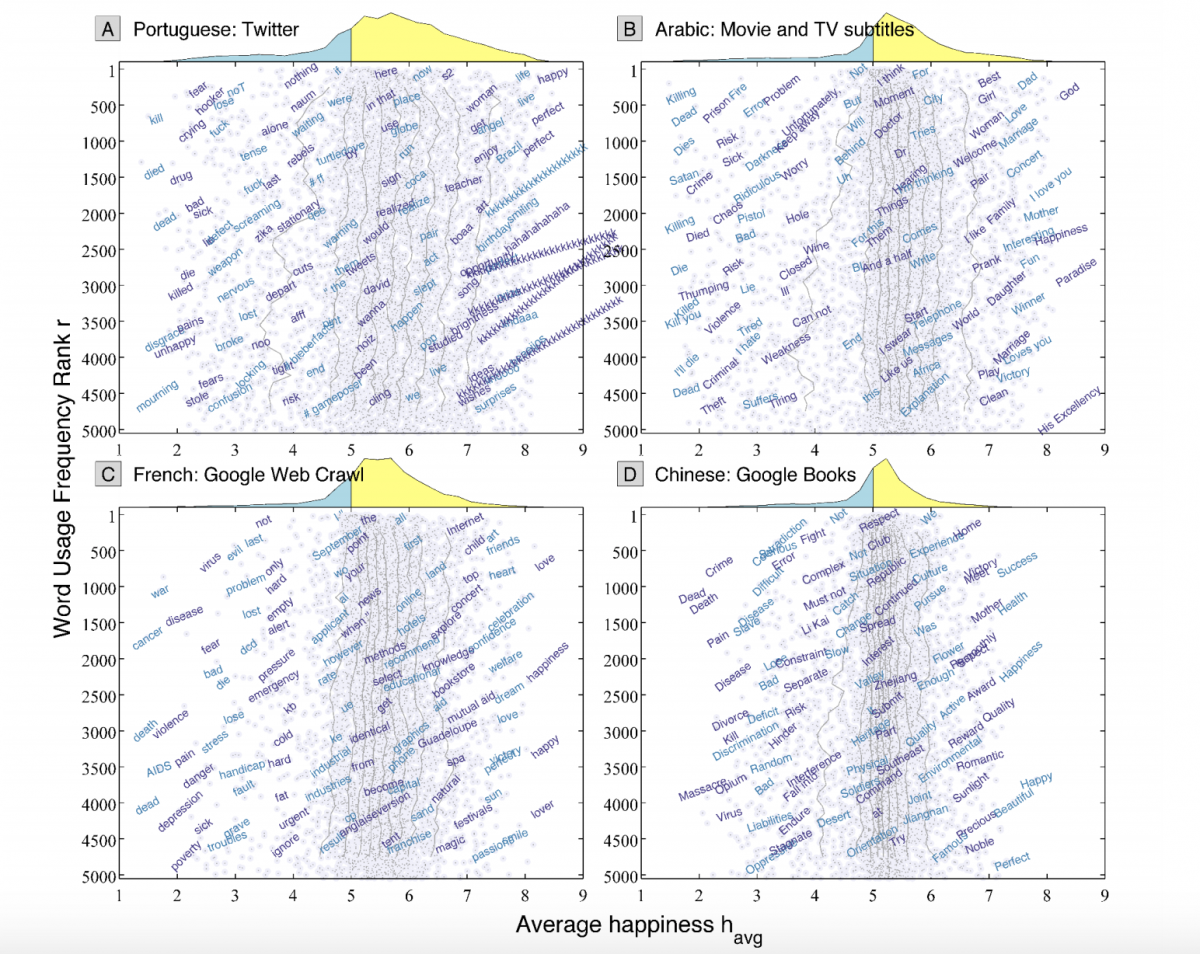
The UVM team recently started expanding this analysis worldwide. Together with an international team, they created lists of the 10,000 most common words used in 10 languages—English, Spanish, French, Brazilian Portuguese, German, Korean, Chinese, Indonesian, Russian, and Egyptian Arabic—based on Twitter messages, Google searches and books, television and movie scripts, and song lyrics in these languages.
The French like to Google phrases with the words “heart”, “friends” and “love”. Brazilians on Twitter like to use the words “life”, “woman” and “happy”. Egyptian movie and television script writers often use the words “dad”,”best”, and “girl”. These word choices may come as no surprise. But what might is how often they are used.
When weighed against each country’s negative word choices, these positive words win out. Based on this the UVM team have concluded that there is an inherent positivity to human language. They published this data-driven analysis of ten languages last month in the journal Proceedings of the National Academy of Sciences. Spanish was cited as the most positive language in the study.
That language is biased toward positive words is a theory that goes back decades. In 1969, the “Pollyanna hypothesis” was developed by psychologists Jerry Boucher and Charles Osgood at the University of Illinois. The researchers determined that people were more likely to use positive words when they spoke. But Danforth and Dodds’ analysis uses big data, thousands upon thousands of words, to measure cultural sentiment, greatly expanding the sample size of cultural well-being studies.
Our social nature is being encoded in real time in everything we post to the Internet. Tools like the Hedonometer are helping us make sense of what the world is saying online.
For journalists that’s good news.


Very well written and interesting piece. Nicely done.
Thanks for reading!