
Takeaways on newsroom innovation from a behind the scenes tour of the Associated Press
The new Associated Press headquarters in lower Manhattan near the World Trade Center is dazzling, and it seems quite fitting for a news company that’s constantly innovating. Earlier this month, Storybench took a trip to New York City to chat with AP global news manager Mark Davies who told us all about how they are winning Facebook.
During my visit, I sat in on one of the morning news meetings where managing editor Brian Carovillano, Davies and others connected with bureaus around the globe to discuss the order of the day. I also spoke to some people in the newsroom about innovation in journalism and storytelling from many perspectives. Below, some takeaways from a day watching the AP from inside.
The role of analytics in AP’s coverage
The first thing you will notice about Davies is that his three screens are always filled with analytics tools monitoring the performance of AP stories. The screens flicker with data piped in from video, website and social platform traffic. Davies uses a host of different services: NewsWhip’s Spike and Syndication, Chartbeat and Teletrax are used for insights which are shared in daily meeting with other AP offices.
Analytics, as I’ve previously written, inform editorial decisions at the AP. They are also a way of keeping an eye on trending stories the agency should be covering. Often, the insights Davies and others draw from performance analysis will inform not just coverage but operational logistics at the AP.
Take a humanitarian disaster, for instance.
“What analytics allowed us to understand better is the story arc,” Davies explains. “Sometimes, we would have three or four crews covering, let’s say, a humanitarian disaster somewhere in the world. Seeing how those stories are performing allows us to decide if we should redirect or divert some of those resources to cover other stories somewhere else, or cover that disaster differently.”
He also mentioned how after the story arc has developed to a certain point, what is asked of the AP coverage is more of a human perspective and less hard news. That’s another insight drawn from the analytics.
 Davies, background, in an analytics demo. Credit: Associated Press.
Automated analytics reports
Over the last few years, the AP has automated parts of its reporting. Sports and business stories are routinely created by a machine, which reads in the data — either a box score or a company’s quarterly financial reports — and spits out a written story or multiple versions of the same story. That, in turn, frees up reporters to pursue other tasks. Davies hopes that the analytics tools he’s using will yield a similar shift.
“If we could spare the human resources we have doing this, and put them to report and do journalism, why not do it?” Davies asks.
The AP has around 150 people across the globe trained in monitoring stories. Machine learning could not only expedite the analytics work, but process much more data than the human mind could and, thus, come up with more insightful analysis of stories’ performances.
Making data-driven videos intelligible
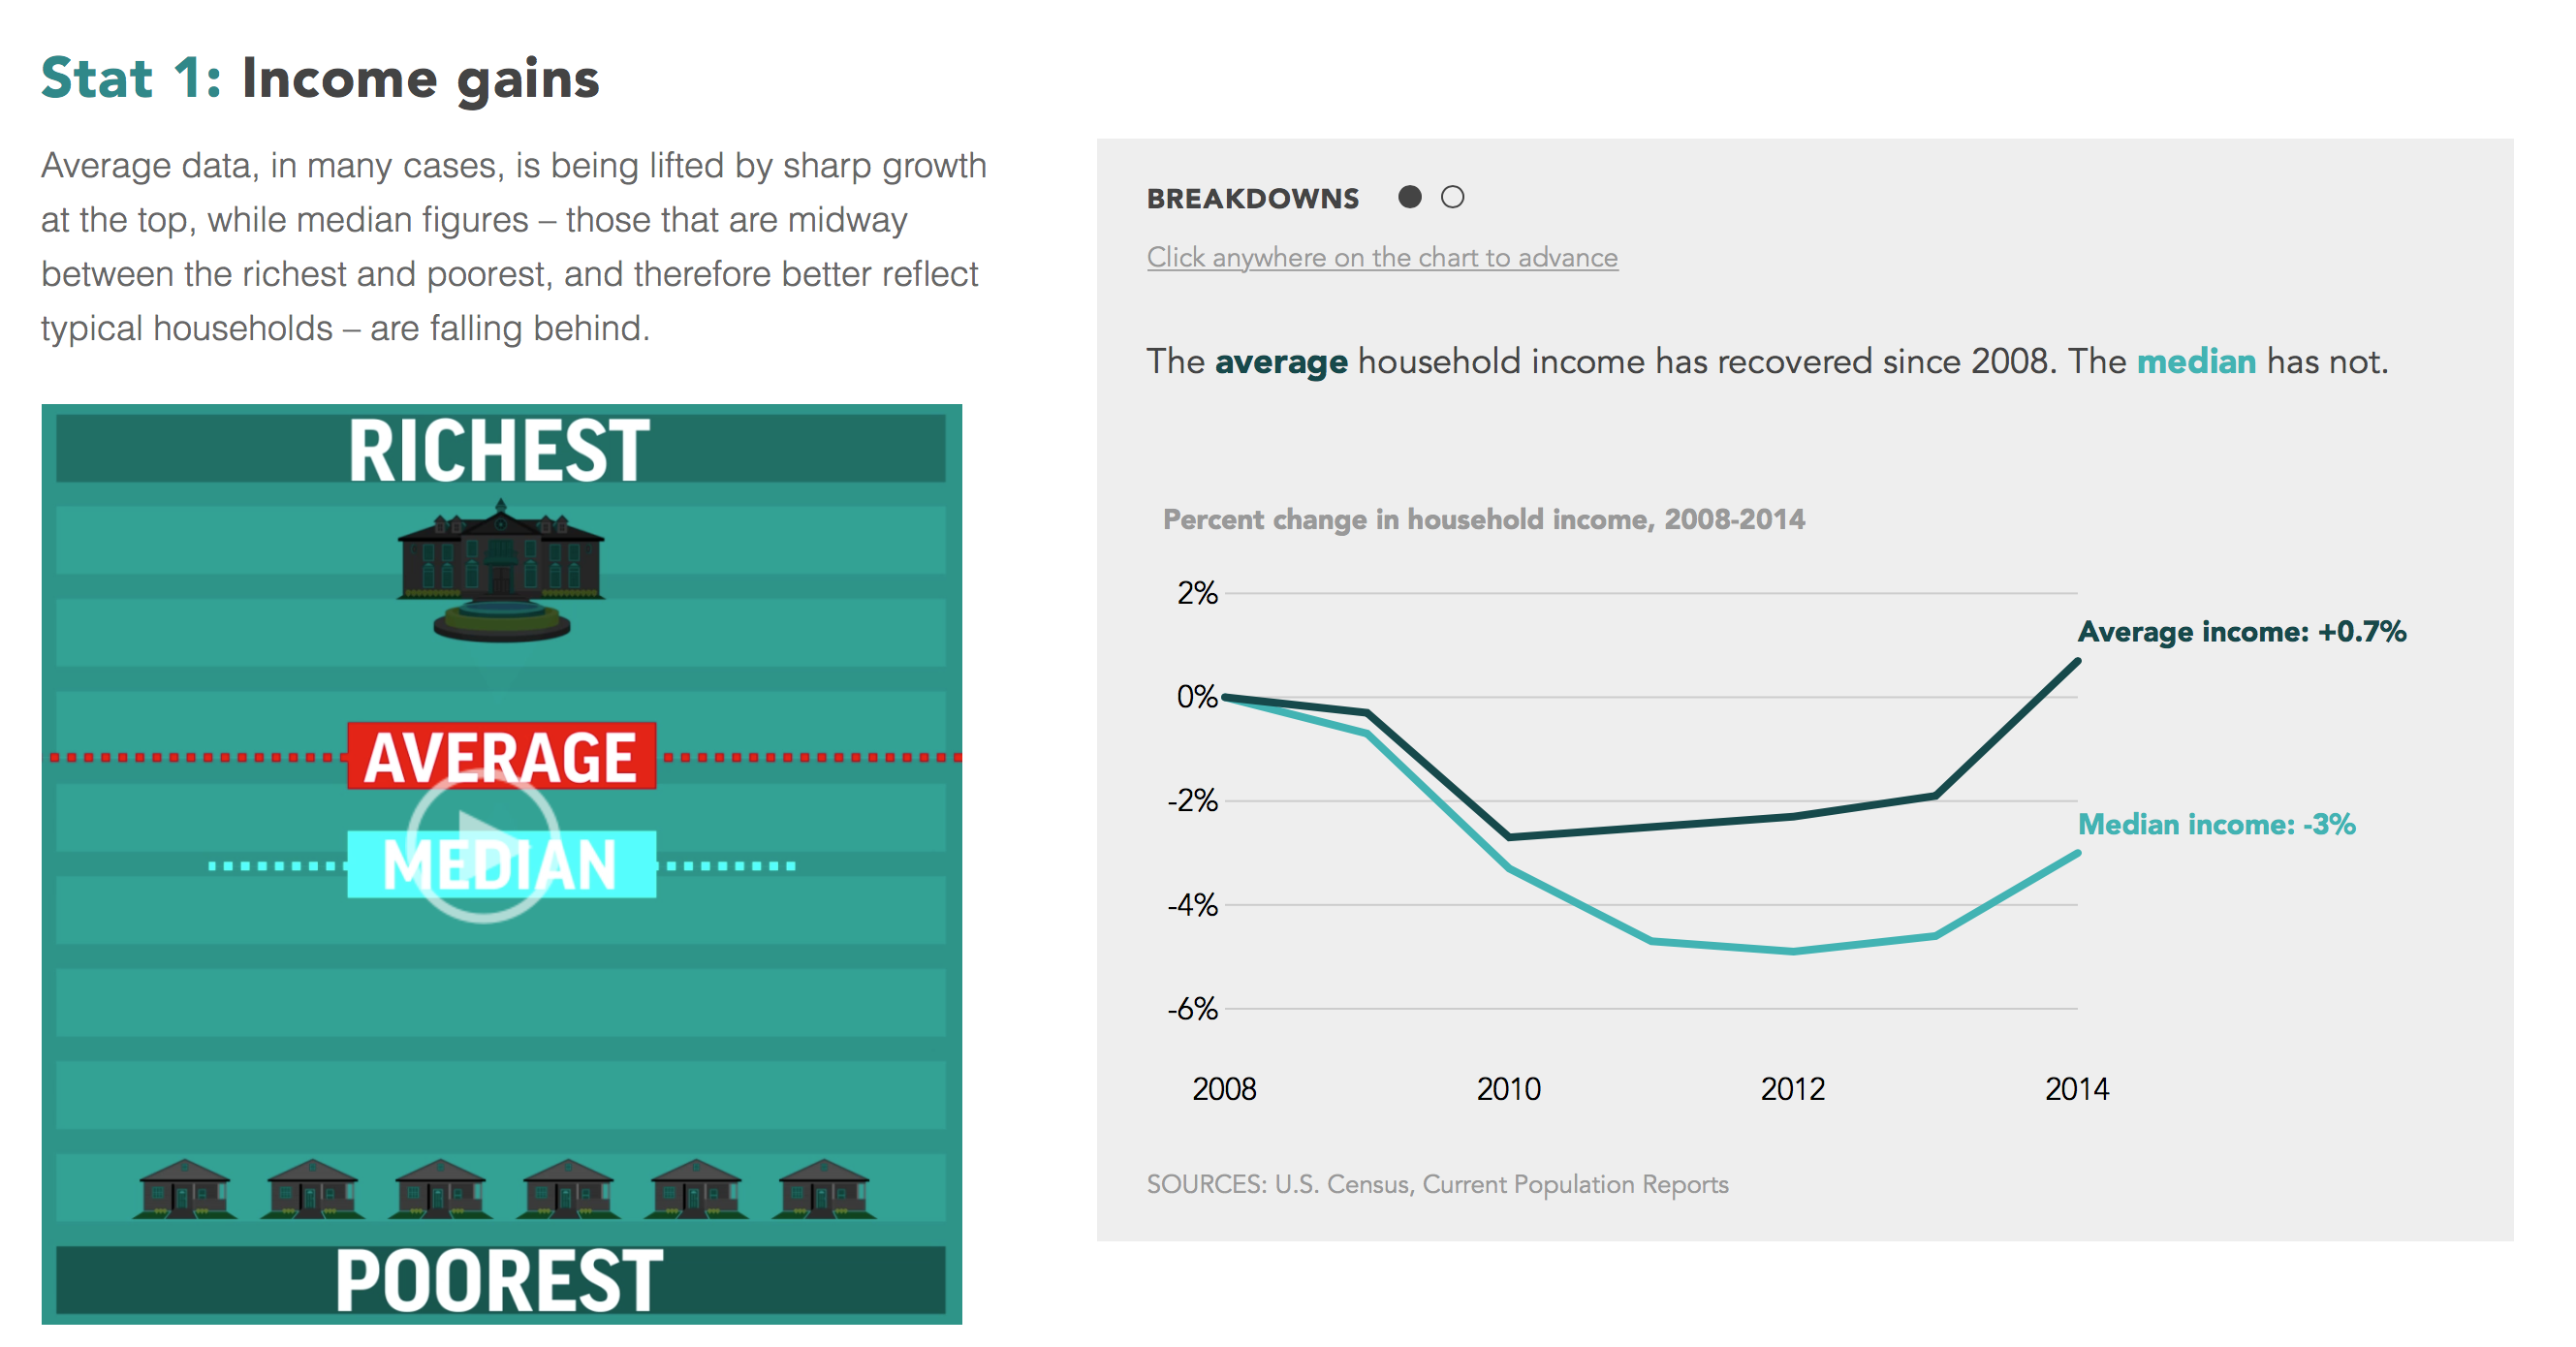
The AP is one of largest content providers in the world. As such, it’s experimented with many different formats beyond traditional wire stories and video feeds. In this interactive piece – which was a joint effort between the reporting, interactive and multimedia video and graphics teams – the AP neatly weaved together video and data. While interactive charts showed data across time, short videos explained important concepts and conveyed salient information to the audience.
That’s easier than it sounds.
“You have to choose a small bit of information, data you are going to use for the video,” says multimedia video and motion graphics manager Darrell Allen.
Usually, writers and editors work together to write the script for the videos, which consist mainly of animations. Then, it’s Allen and his team’s turn to put Adobe Illustrator and After Effects to work to make the animations. Despite all the data, comprehension is paramount.
“The important thing is making it simple enough so that the viewer will understand,” Allen says.
Dynamically updating data-driven videos
The AP has also been working on a concept that may become a game-changer: videos updated in real time.
“One of the things about numbers is that they can change quickly, they are too fluid,” Allen says of the obstacles posed by the video format for data-driven stories. A solution for that could be automated scripts that pipe in new data and then re-render the video files.
If this is indeed a new door the AP opens, cutting and rendering new video to accommodate new pieces of data would become an obsolete task. With this kind of automation, video pieces could be kept up to date on the fly. That, says Allen, would truly be dynamic.
“All information you see on the screen, be it text or data, can be updated through code, not a human.”
Feature image: Mark Lennihan/AP Photo.
- SXSW: ‘Excel is okay’ and other tweet-size insights for data journalists and news nerds - March 17, 2018
- NICAR: Data stories from last year that you could be doing in your newsroom - March 13, 2018
- How to scrape Reddit with Python - March 12, 2018