How to do super simple textual analysis
The following tutorial was adapted from an in-class exercise used by Derek Willis in his data reporting class at Georgetown University. Willis works at The New York Times with its data-driven reporting arm The Upshot. Willis tells Storybench that he uses a very simple web-based tool called Web Frequency Indexer for this textual analysis exercise because it requires little prior knowledge of data analysis. Willis says: “While it would be more efficient and powerful to use Python or any number of other tools, I stick to this because I want to illustrate the concept in a way I hope they’ll be able to understand easily.”
Update: Use WordCounter for textual analysis, built by Catherine D’Ignazio and Rahul Bhargava.
Getting the data
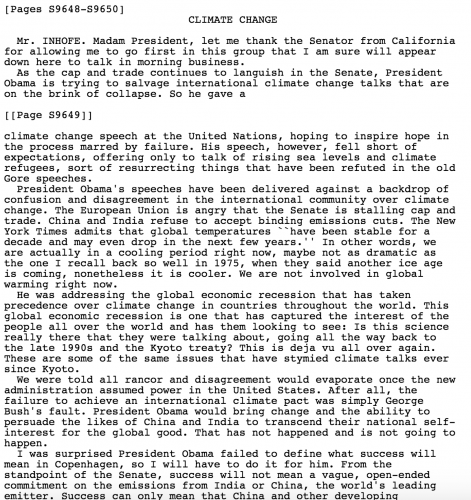
After inspiring his students with a textual analysis of past State of the Union addresses published by The New York Times, Willis asked them to analyze a 2009 Senate speech by Senator James Inhofe on climate change.
Copy the text (Ctrl-C or Command-C) from the Inhofe’s climate change speech.
Perform textual analysis
Paste the text into the web-based Word Frequency Indexer.
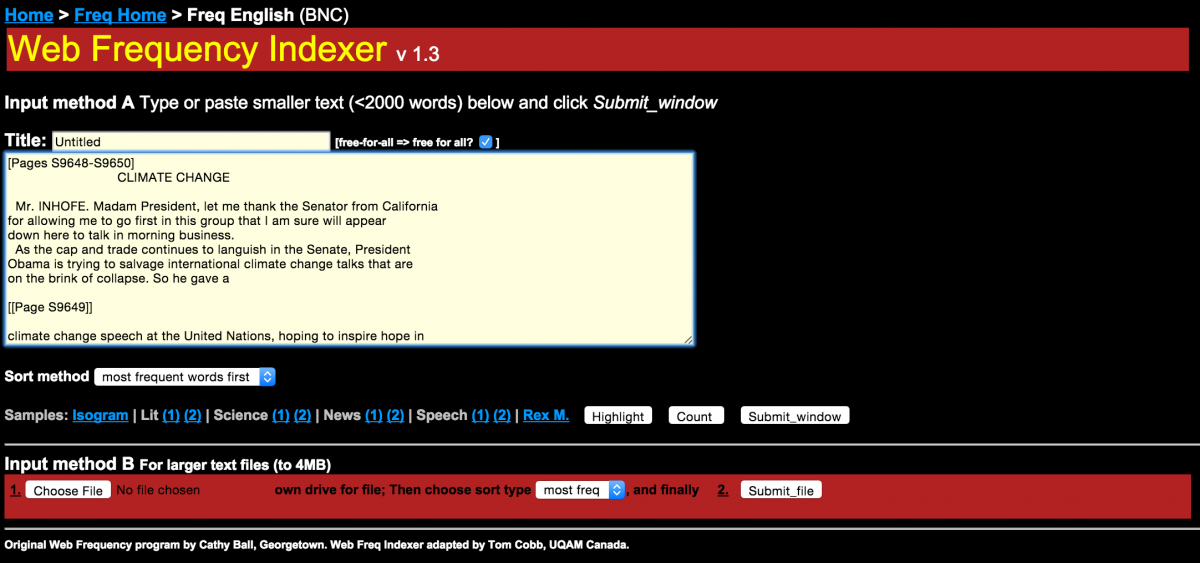
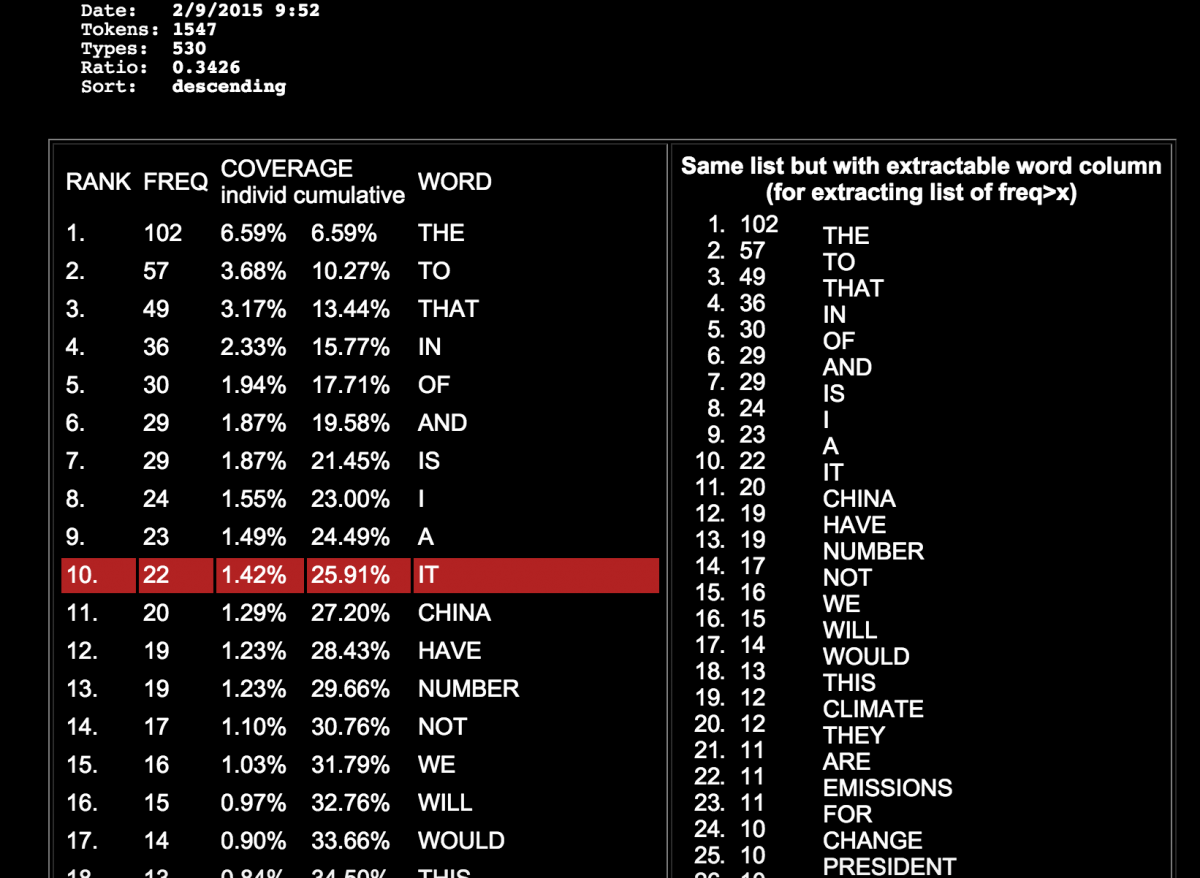
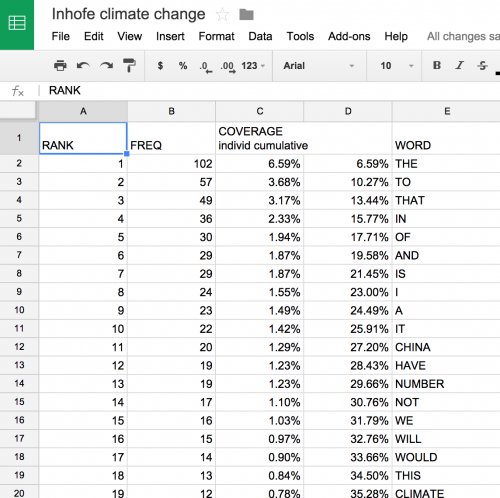
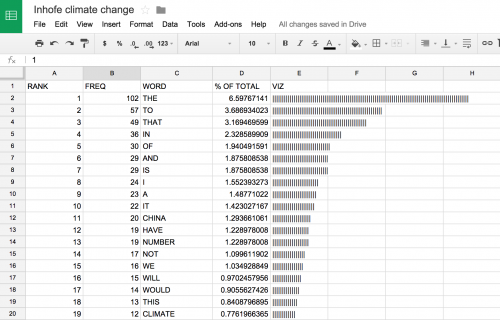
Click the button labeled Submit_window. The following results will be generated. What do you notice? Clearly the words “the”, “to”, and “that” are the most frequently used. But “China” is also frequently used.
Cleaning the data
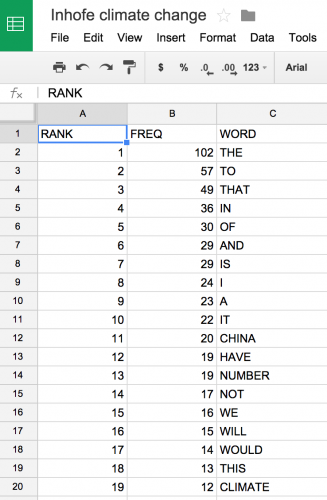
Next, copy and paste the left-hand table into a Google Spreadsheet.
Delete columns C and D for simplicity’s sake.
Visualize the data
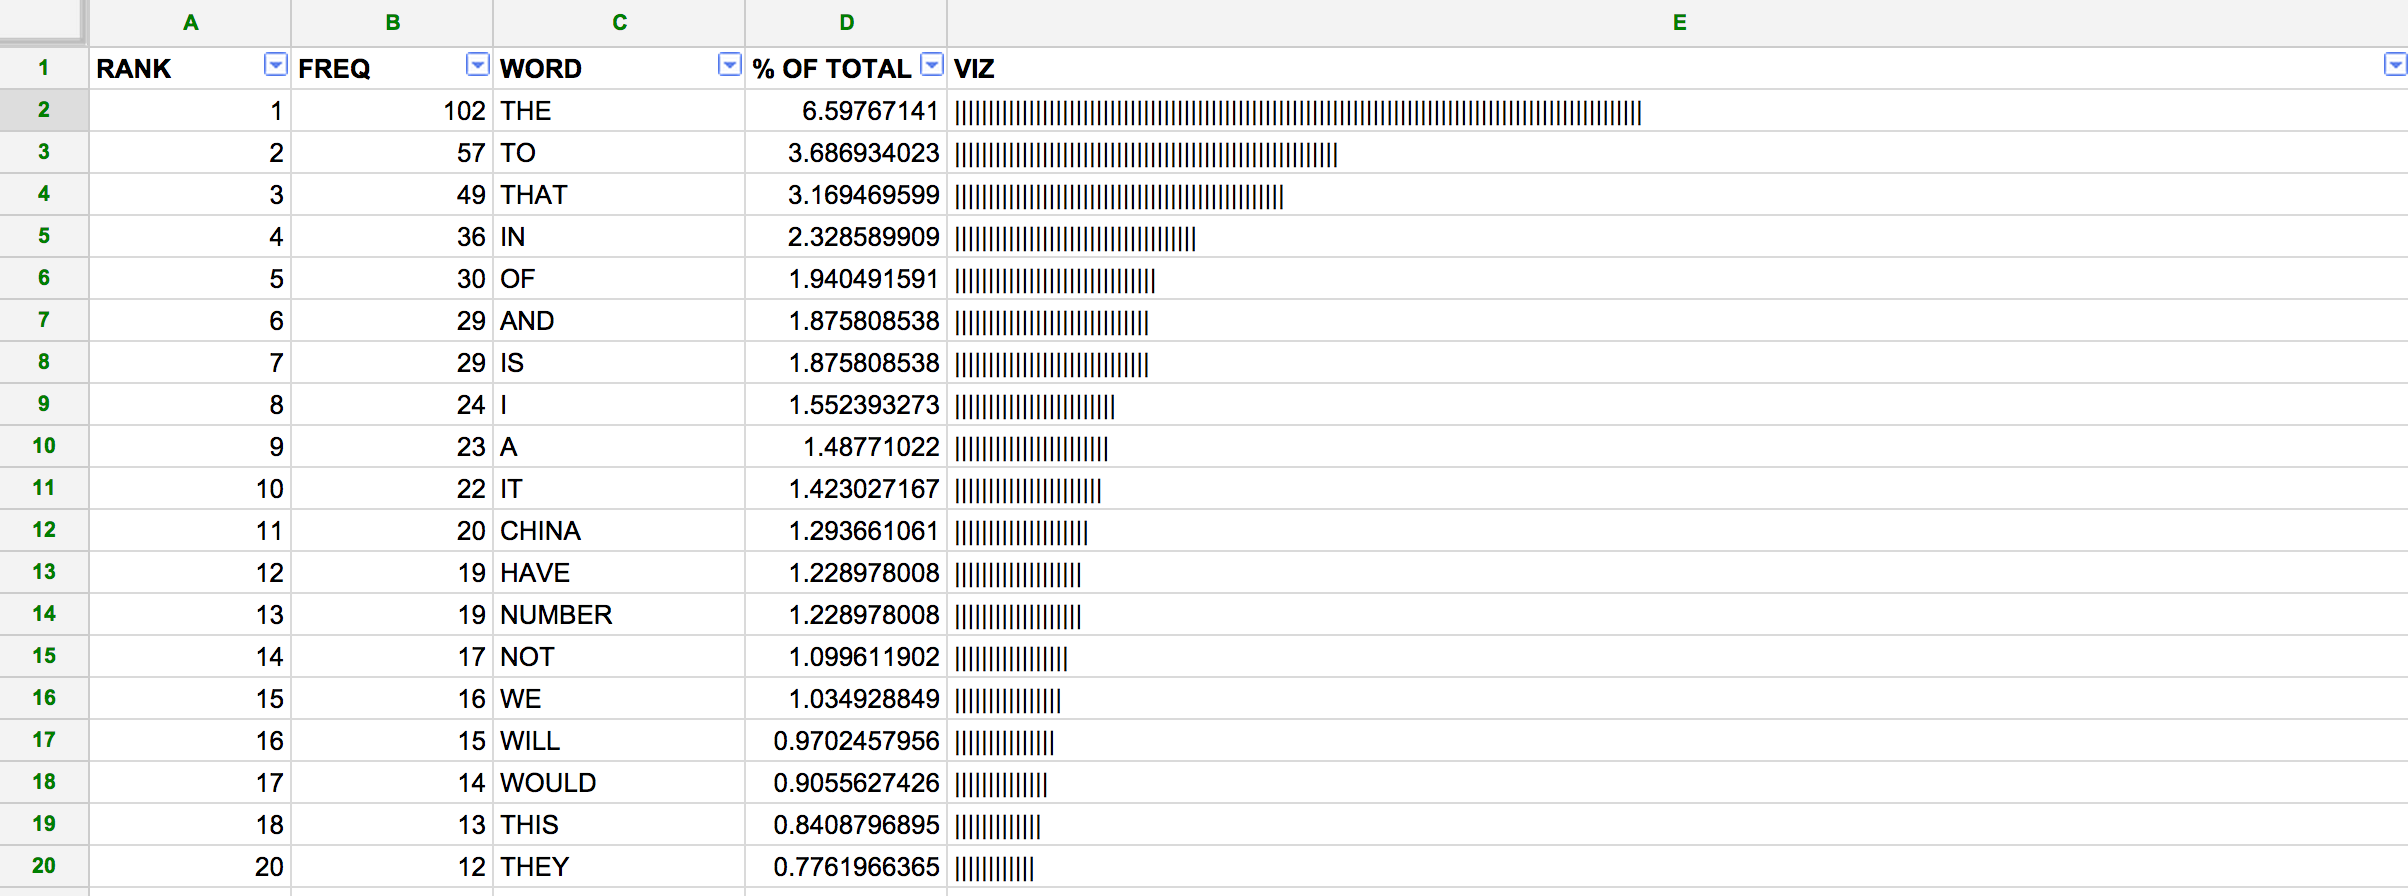
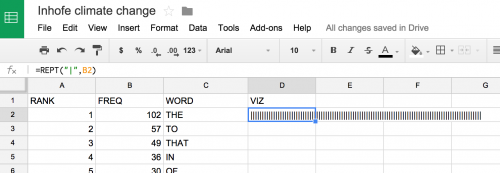
We can quickly visualize each word’s frequency using the in-cell bar chart function. This is a fun trick that assigns a certain character to a number and repeats the character based on that number. So, for a cell containing XXXXXXXXXX, all I need to type is:
=REPT("X",10)
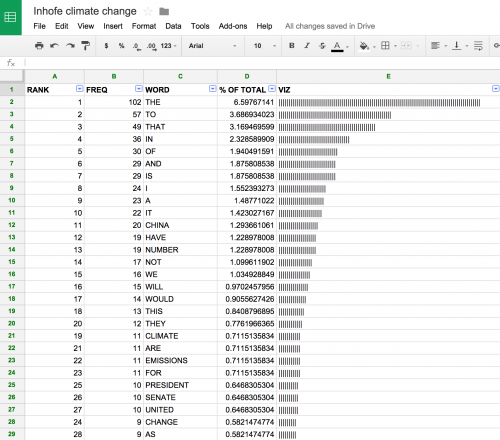
By using =REPT(“|”,B2) in the D2 cell, we will end up with a visual tally of the frequency listed in B2.
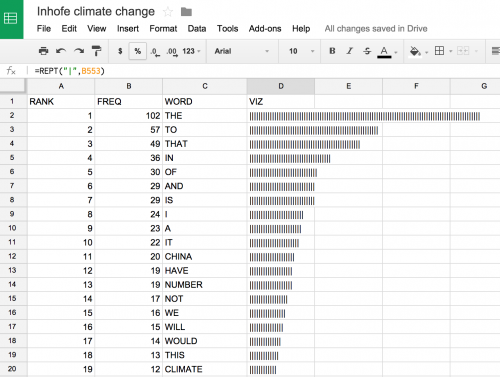
Next, grab the lower-right-hand corner of the cell and drag down to apply the same equation to all rows.
Next, calculate the percent of total words that each word represents. To do so, calculate the sum of the frequency column =SUM(B2:B530) to obtain 1,546 words in the speech. I then passed that sum into the equation =(B2/1546)*100. I added a separate column to include this figure.
A discrepancy in the data
I doubled checked the total word count (1,546) by heading back to the original speech transcript. The word count is correct, save for two extra words that made it in, “Climate” and “Change”, from the transcript’s title. These would need to be stripped from the data. This points to an essential caveat of data-driven journalism. You need to be as ethical and rigorous with your data as you would be with a human source. What is the data leaving out? What is it lying to you about?
I stripped out one instance each of “climate” and “change” and added a Filter from the drop-down menu Data to sort the table by descending word frequency.
Journalistic questions
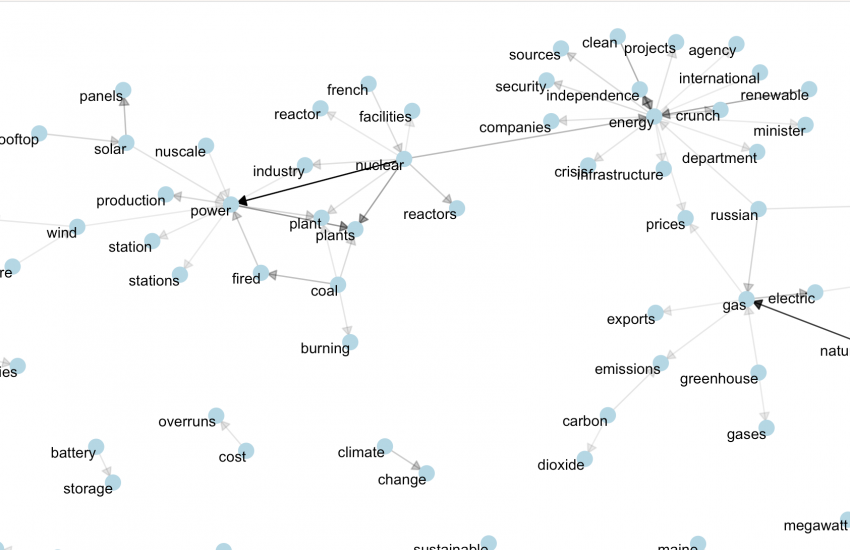
“If you were writing about Inhofe and climate change, what topics do the word frequency index and the in-cell bar chart suggest?” Willis asks his students. The high incidence of the word “China” is intriguing. Going back to the transcript, one finds that Inhofe speaks at length about China’s refusal to accept binding emissions cuts.
For more on story hunting in data, Willis points to Anthony DeBarros‘ insights on finding stories in birth, death data.


Nice way to do a quick visualization! It seems that the original column C, which you deleted “for simplicity’s sake'” already had the percentage frequency of each individual word in it, so if you keep that column, you don’t need to re-do the calculation and add it back in.
Thanks David! I realized that later on, but thought it’d be great to point out how one would calculate that number. Cheers.