
How to Analyze bluesky Posts and Trends with R
If the only things you’re doing on bluesky are scrolling, liking and posting, then you are still riding a bike with training wheels. Hear me out.
There are several simple and free tools out there that let you take advantage of bluesky’s secret weapon: its open-source skeleton.
A how-to
A few firehose ideas:
- Pull thousands of posts to look for trends
- See how key phrases change over time
- See articles others are recommending
First, you’re probably thinking: why spend time doing this? We have this embedded idea that truly great content will always rise to the top. For a detailed discussion on why not, see these. But the short answer is: quality is part of the equation but not the whole story.

You can’t download all two billion posts, but you can download a whole lot more than you ever could scrolling. And you can use that data to look for patterns. For example, what if we took a look at 100,000 posts from the last day?

Analysis idea number one: what comes up most often? Here, we take out the most popular words (prepositions, etc.) and look only at the frequency of other words.

Idea number two: Looking at which words were important in each hour. To do this, we are going to employ a neat little trick called TF-IDF. Check out Julia Silge’s work here for a full explanation but essentially: What words were important in each chunk?
This is really fascinating to see the effects of time zones, and when certain news broke!

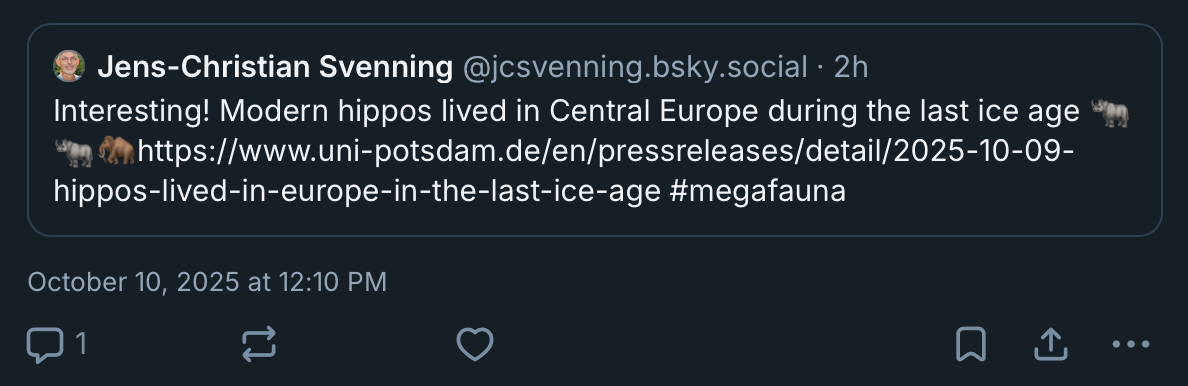
Another idea: let’s say you want to see not just what people like, but what others are recommending to their friends. For example, this post doesn’t have many likes, but already has a lot of reposts. And so neat! I did not know this about hippos.
This is just scratching the surface. There’s a lot of really granular data here. You can have fun with this! HMU with more ideas!

The code for this can be found here.
This mostly uses the bskyr #rstats package developed by Christopher Kenny. Check out his vignettes here.
This also looks cool: David Hood shows you can build a big selection of follower/following connections from an initial curated list of related people on his Github.
Disclaimers! I am not employed by bluesky, nor do I know anyone who is. This is not an endorsement and I have not extensively tested how well this works. Please respect the rate limits; this prevents overwhelming the system. And big thanks to Mike Stucka (@mikestucka.bsky.social ) and all the folks at IRE who encouraged me to test this out. I was very against signing up for yet another social media site until I saw what it could do!

- How to Analyze bluesky Posts and Trends with R - November 4, 2025
- Easily clean up messy databases with fuzzy matching in R - September 16, 2025
- How to use R to analyze racial profiling at police stops - November 21, 2023


