How the Pudding analyzed YouTube “vlogpologies”
What does a YouTuber do if they’re caught in a scandal? Usually, they’ll film themselves explaining that they’re sorry and how they intend to change, and then upload the apology video online in hopes of being forgiven, and perhaps adding more followers.
Russell Goldenberg and Arjun Kakkar of The Pudding dissected 34 YouTube apology videos, or “vlogpologies,” including the apology video for the scandal that sparked perhaps the most public backlash, when a vlogger filmed and uploaded footage of a corpse in Japan’s Aokigahara Forest, known as the “suicide forest.”
So how do some of these apology videos affect their subscriber growth, and do they have lasting impact? Storybench interviewed Goldenberg to discover how the story came to be, and how they used data to gauge how the audience’s reception to the apology videos might be reflected in their subscriber rate and growth after the videos’ release.
How did you come up with the idea for this story and what your role in producing the piece?
Russel Goldenberg: The idea actually came from a conversation that I had with my coworkers at lunch a year and a half ago. We were just talking about YouTube, and I think the idea of YouTube controversies came up and [we] were shocked at how many there were. I just had a question of how it affects their YouTube careers. We talked about it for a little bit and I just kind of tabled the idea. About a year and a half later, Arjun, who I ended up doing this story with, said how he had some data to try to answer that question and that’s kind of how the idea got into development.
How did you determine the best way to convey the data through visuals?
For this story, I was responsible for the story and the design and most of the development. Arjun did some of that as well, and Arjun did some of the data processing. For this story, I wanted it to be mostly linear, in a swipeable format. A lot of the time we would go with this exploratory mode. For this story, it would have been better to walk the reader through this narrative because not everybody is familiar with this phenomenon and not everybody knows who these people are unless they are really into the YouTube world. I thought it was good to kind of slowly introduce the subject and why I think it’s interesting and why this is a story worth telling.
I tried to ease the reader into the data as well. The first chart really gives you an explanation of the different types of controversies rather than jumping straight into the data of the subscribers’ impact to set up the scene as to why there are these YouTube apology videos.
The meat of the story from the data standpoint is the line chart, which gets into the subscriber growth rate. We broke this chart in pieces because by stepping the readers through the chart the hope is that it would be easier to understand and see the impact that their apology videos had on their subscriber count.
Was there any one piece of data or information that you discovered when you were dissecting the apology videos that was most interesting?
It was surprising to see how many of the YouTubers were not really affected by their controversies and their apologies. I feel like very few of them had very noticeable drop-offs, whereas I feel like most people just keep continuing to grow their subscribers relatively steady. Even some like Jake Paul actually grew even at a higher rate after the controversy and apology. It kind of reflected that old saying of “no news is bad news,” which is a little disheartening for me as a reader.
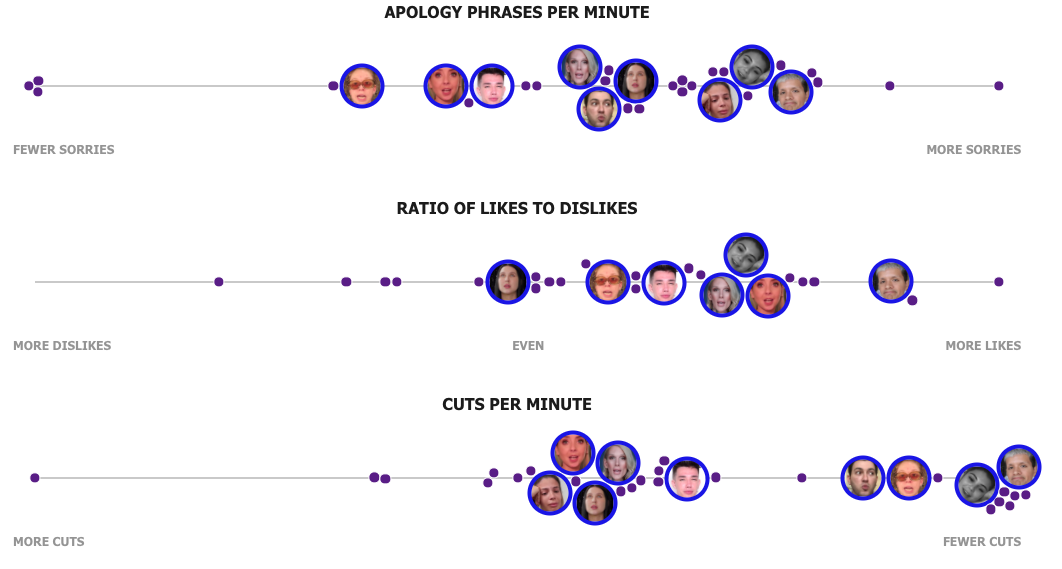
What tools did you use to mine the data from the videos, such as the apology phrases per minute, ratio of likes to dislikes, and cuts per minute?
For the apology phrases per minute it was done programmatically. Same as the ratio of likes and dislikes; we pulled that from the videos. Cuts per minute was a combination of programming and manual work. Arjun actually used a program called PySceneDetect and also manually looked at different videos as they have different styles.
What was your favorite part about working on this project?
I’m actually not a huge YouTube follower, so a lot of these stories of people were new to me. So actually getting to know in-depth about each YouTuber and the controversy and learning about their channels in general were the most interesting to me, as I expanded my knowledge into this new domain.
What is your impression of how it was received by the audience?
We always define success differently for every project. From a pageview standpoint, it was not one of the most-read stories; however, there was actually a specific Reddit thread that picked it up. It was a beauty community on Reddit, and there was a lot of conversation in that thread. I was really excited to see them using the story as a jumping point in discussing all of the different apologies.
Do you have some tips for new data journalists on how to use effective visualization, and how to achieve the goal of telling a strong story?
I would say my go-to advice is usually to tell something you’re really interested in. It will really sustain your effort of looking at it from different perspectives. I found that if I’m working on something that I’m not totally passionate about, I might be less inclined to see it through. And then another piece of advice is probably not to just go with the first visual idea that you think of. Experiment with other modes of presentation and try to keep an open mind with the form it takes on. Usually, when you start to play around with the data, it might change.
- How the Pudding analyzed YouTube “vlogpologies” - April 14, 2020


