From CSV to Spinning Sphere: How to Build a Scrollytelling Globe with D3.js
Let’s be real: tools like Mapbox and Leaflet are great. You click a few buttons, and boom—you have a map. But if you want something fully custom—a 3D globe that moves with your story, “flying” from a close-up flight path to a global view just by scrolling—D3.js is still the GOAT.
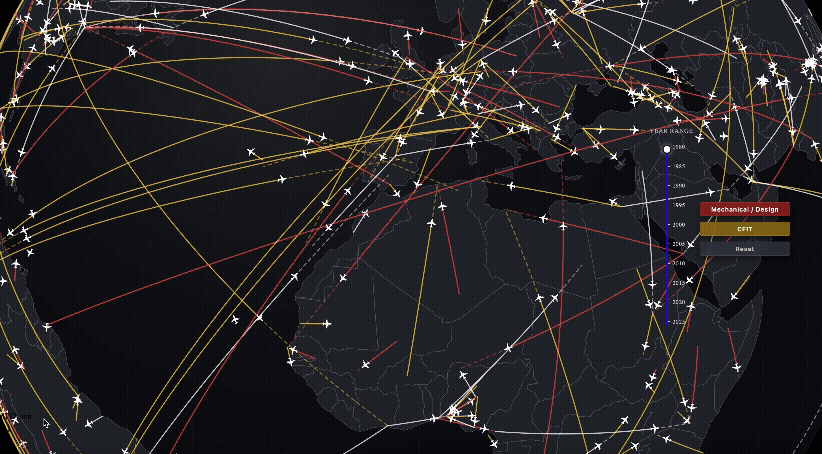
No fluff today. I’m going to show you exactly how to build the interactive 3D globe I used in my recent project using D3.js + TopoJSON. (You can check out the live project here).
Full disclosure: I’m still pretty new to HTML, CSS, and JS. I definitely fumbled around a lot to get this working. (I have to admit that AI tools were a huge help for inspiration and guidance when I was trying to build things I didn’t fully understand yet. While classmates recommended Claude, I personally leaned on Gemini—it understood my confusion better and explained the logic clearly when I got stuck. Highly recommend finding the AI co-pilot that “speaks your language”!)
The best part is that this code is reusable. You can take this template and plug in your own data—whether you’re mapping global coffee trade routes, international student travel paths, or any other story that needs a global perspective.
Step 0: The Ingredients (Preparation)
Before we start cooking, let’s look at the recipe. We need two main libraries. Don’t worry, you don’t need to download a bunch of files—we can just use CDN links to keep things light.
- D3.js (v7): The “boss” of data visualization. It handles all the heavy lifting—calculating how to flatten a sphere onto your screen.
- TopoJSON: This is for drawing the land. It’s much lighter and faster than GeoJSON.
The only thing that matters is making sure these two CDN links are inside your <head> tag. Without them, D3 is just a mute mime.
HTML
<script src="https://cdn.jsdelivr.net/npm/d3@7"></script>
<script src="https://cdn.jsdelivr.net/npm/topojson-client@3"></script>
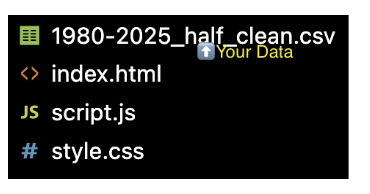
<svg id="viz"></svg>To make the globe look like it’s floating in deep space rather than stuck on a piece of printer paper, let’s paint the background black in style.css and hide the scrollbars (to avoid those awkward white edges).
CSS
body { background: #000; overflow: hidden; margin: 0; }
#viz { width: 100vw; height: 100vh; display: block; }
And your folder structure here:
Step 1: Building a “Naked” Globe (The Setup)
The core logic of drawing a map in D3 actually only has three steps. Seriously, just three:
- Data: What the world looks like (land shapes).
- Projection: How we look at the world (is it a flat map or a 3D sphere?).
- Path Generator: The “pen” that draws the SVG paths based on the projection.
In our script.js, we are going to use d3.geoOrthographic(). That’s just a fancy word for “3D Sphere Perspective.”
Here is the formula to get a basic globe running:
JavaScript
// ====== The Standard Setup ======
const width = window.innerWidth;
const height = window.innerHeight;

// 1. Define the Projection: This is basically our camera lens.
const projection = d3.geoOrthographic()
  .translate([width / 2, height / 2]) // Center the globe on the screen
  .scale(width * 0.45)                // Size: 45% of the screen width
  .clipAngle(90);                     // CRITICAL: Clip at 90 degrees. This hides the "back" of the world, creating the 3D sphere illusion.

// 2. Define the Path Generator: This is the "pen" that follows the projection.
const geoPath = d3.geoPath(projection);

// 3. Render the Globe
const svg = d3.select("#viz");

// Layer 1: The Map (Bottom Layer)
// Any element appended to 'mapGroup' will sit at the back.
  const mapGroup = svg.append("g").attr("class", "map-layer");

// Layer 2: The Flights (Top Layer)
// Any element appended to 'flightGroup' will sit on top of the map.
  const flightGroup = svg.append("g").attr("class", "flight-layer");

// First, draw the "Ocean" (It's really just a background circle for the sphere)
mapGroup.append("path")
svg.append("path")
  .datum({ type: "Sphere" }) // D3 has a built-in sphere geometry
  .attr("class", "ocean")
  .attr("d", geoPath)
  .attr("fill", "#0a0c10"); // Pick your ocean color

// Load the map data (TopoJSON)
d3.json("https://cdn.jsdelivr.net/npm/world-atlas@2/countries-110m.json")
  .then(world => {
    // Convert TopoJSON to GeoJSON so D3 can understand it
    const land = topojson.feature(world, world.objects.countries);

    // Draw the land
    svg.append("path")
      .datum(land)
      .attr("class", "land")
      .attr("d", geoPath)
      .attr("fill", "#232731") // Pick your land color
      .attr("stroke", "#5b5a65"); // Border color
  });
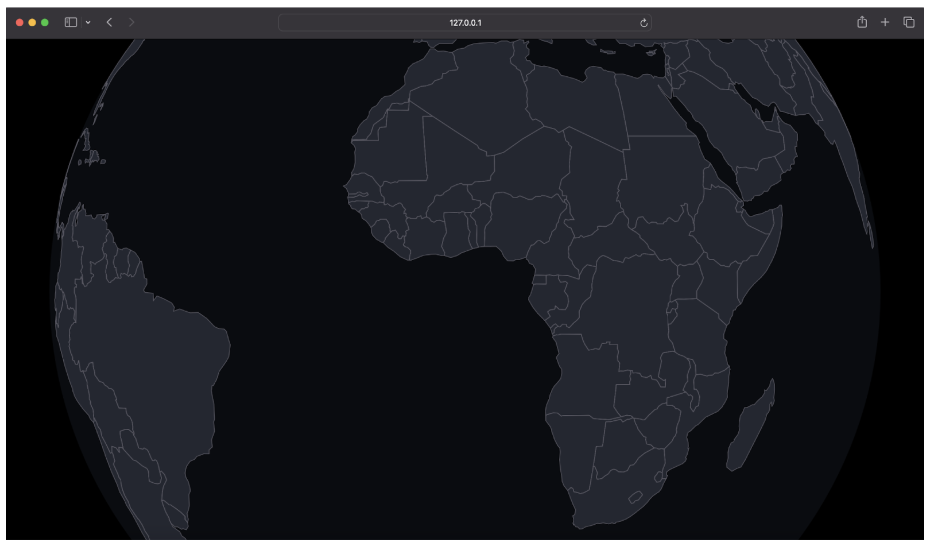
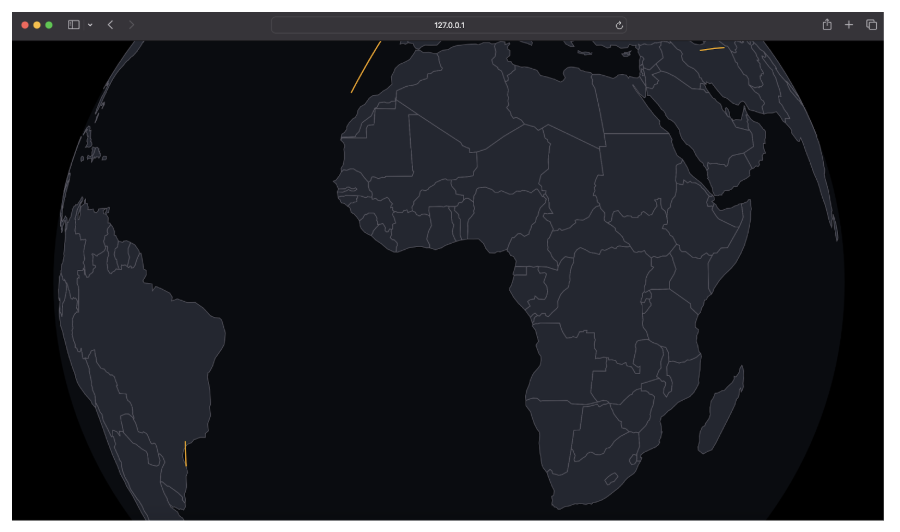
Open index.html, and you should see a dark, cool, “naked” globe floating there. Once you see this, the foundation is solid.
Step 2: Plotting & Connecting: The “Great Circle” Routes
This is the coolest part. On a flat 2D map, a straight line is the shortest distance between two points. But on a sphere? The shortest path is a Great Circle — that beautiful arc you see on in-flight entertainment screens.
D3 doesn’t have a built-in function like drawFlightPath(), but we can calculate it ourselves using interpolation (d3.geoInterpolate).
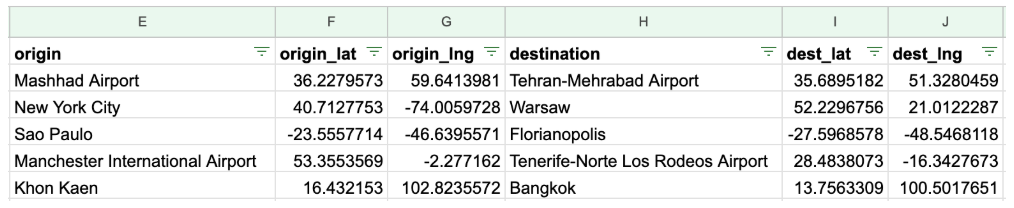
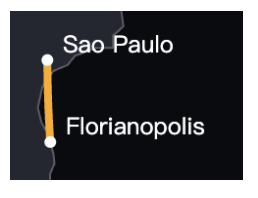
First, you need some data. Your CSV file just needs to look like this (simple coordinates for start and end points, take the first five rows of my project as an example):
Here is the code I used to draw the curved lines:
JavaScript
// ====== Core Function: Calculate the arc between two points ======
// Input: Start [Lng, Lat], End [Lng, Lat]
function arcSegment(startLL, endLL) {
  // D3's interpolator automatically calculates the path along the sphere's curvature
  const interpolator = d3.geoInterpolate(startLL, endLL);

  // We slice the line into 100 tiny segments to make the curve look smooth
  const samplePoints = d3.range(0, 101).map(i => interpolator(i / 100));

  // Return a GeoJSON LineString for geoPath to render
  return { type: "LineString", coordinates: samplePoints };
}

// ====== Load and Plot Data ======
d3.csv("your_data.csv").then(data => {
  // Loop through each row of your CSV
  // Create a group to hold all flight paths
const flightGroup = svg.append("g").attr("class", "flights");

  data.forEach(row => {
    // 1. Parse coordinates
    // Remember to convert string data to numbers using (+)
    const start = [+row.origin_lng, +row.origin_lat];
    const end =   [+row.dest_lng,   +row.dest_lat];

    // 2. Calculate the Great Circle path
    const routePath = arcSegment(start, end);

    // 3. Draw the Path
    flightGroup.append("path")
       .datum({
           type: "LineString",
           coordinates: routePath.coordinates })
       .attr("d", geoPath) .attr("fill", "none")
       .attr("stroke", "#ffaa00")    // Line color: Highlight Yellow
       .attr("stroke-width", 2)
       .attr("stroke-opacity", 0.6);
    });
  });
Now, we have lines, but they are ‘dumb’—they don’t know where they are going. To add labels on hover, we need to attach more data to each line.
We don’t just want to draw lines; we want them to react.
Here is a common rookie mistake: If you try to draw every single city label at once, your globe will look like a messy hairball.
The Pro Move: We use “On-Demand” labeling. The city names for “Start” and “End” are only stamped onto the map when you hover over a specific flight path.
Update your d3.csv block with the following code. Notice how we are now passing an object { … } into .datum() instead of just the geometry.
JavaScript
// ====== Step 3: Upgrade with Interaction ======
// (Replaces the code from Step 2)
d3.csv("your_data.csv").then(data => {
const flightGroup = svg.append("g").attr("class", "flights");
data.forEach(row => {
const start = [+row.origin_lng, +row.origin_lat];
const end = [+row.dest_lng, +row.dest_lat];
// ★ New in Step 3: Get City Names
const originName = row.origin || "Start Point";
const destName = row.destination || "End Point";
const routePath = arcSegment(start, end);
flightGroup.append("path")
// ★ Updated Datum: Now includes names!
.datum({
type: "LineString",
coordinates: routePath.coordinates,
startLL: start,
endLL: end,
origin: originName,
destination: destName
})
.attr("d", geoPath)
.attr("fill", "none")
.attr("stroke", "#ffaa00")
.attr("stroke-width", 2)
.attr("stroke-opacity", 0.6)
.style("cursor", "pointer") // ★ Visual Cue
// ★ Interaction: Mouse Over (Show Labels)
.on("mouseover", function(event, d) {
d3.select(this).attr("stroke-width", 4).attr("stroke-opacity", 1);
addCityLabel(flightGroup, d.origin, d.startLL);
addCityLabel(flightGroup, d.destination, d.endLL);
})
// ★ Interaction: Mouse Out (Hide Labels)
.on("mouseout", function() {
d3.select(this).attr("stroke-width", 2).attr("stroke-opacity", 0.6);
flightGroup.selectAll(".city-label").remove();
});
});
});
// ====== Helper Function: Stamp Label ======
// (Add this function at the bottom of script.js)
function addCityLabel(selection, name, lngLat) {
const pos = projection(lngLat);
if (!pos) return;
selection.append("circle")
.attr("class", "city-label")
.attr("cx", pos[0])
.attr("cy", pos[1])
.attr("r", 3)
.attr("fill", "white")
.attr("pointer-events", "none");
selection.append("text")
.attr("class", "city-label")
.attr("x", pos[0] + 8)
.attr("y", pos[1] - 4)
.text(name)
.attr("fill", "white")
.attr("font-family", "sans-serif")
.attr("font-size", "12px")
.attr("text-shadow", "0 2px 4px black")
.attr("pointer-events", "none");
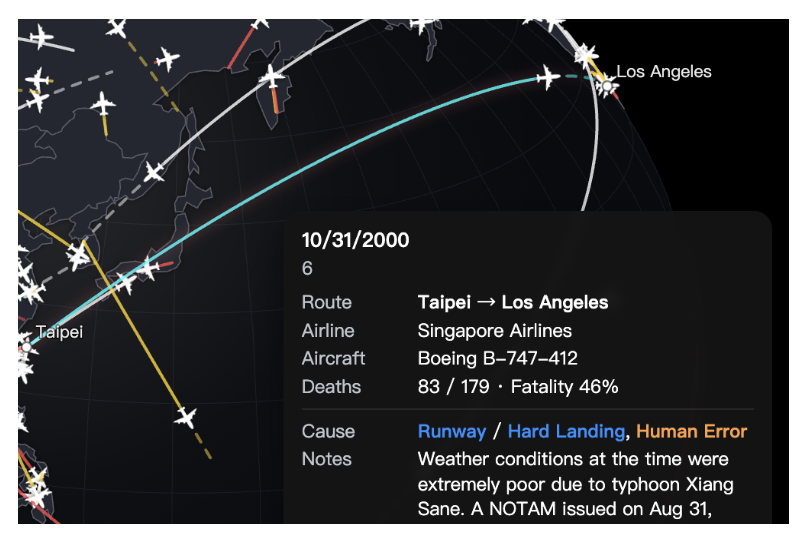
}Look!
In my code, I call this function inside the mouseover event, so labels only appear when the user hovers over a specific flight path. Keeps things clean!
Step 3: Let Them Play (Draggable Globe)
We have a spinning globe with flight paths, but it’s still a bit static. Users want to touch it. Let’s add the ability to grab and spin the globe manually.
D3 has a built-in d3.drag() behavior that makes this super easy. It’s essentially updating the projection’s rotation based on how much you move your mouse.
Add this block to the end of your script.js:
JavaScript
// ====== Step 3: Drag Interaction ======

// 1. Define the drag behavior
const dragBehavior = d3.drag()
  .on("drag", (event) => {
    // A. Get current rotation
    const rotate = projection.rotate();

    // B. Calculate sensitivity (move slower when zoomed in)
    // "75" is a magic number that feels right for sensitivity
    const k = 75 / projection.scale();

    // C. Update rotation based on mouse movement (dx, dy)
    projection.rotate([
      rotate[0] + event.dx * k,
      rotate[1] - event.dy * k
    ]);

    // D. Redraw the map and lines with the new rotation
    svg.selectAll("path").attr("d", geoPath);

    // E. IMPORTANT: Remove any floating labels!
    // If we don't do this, the city names will get stuck in mid-air while the globe moves.
    svg.selectAll(".city-label").remove();
  });

// 2. Apply the drag behavior to the SVG container
svg.call(dragBehavior);
Refresh the page. Now, the world is literally in your hands.
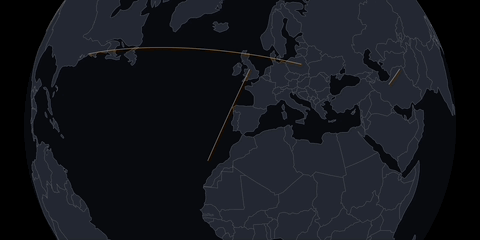
Step 4: Directing the Camera (Auto-Rotation)
Simple Version
We’ve built a cool interactive toy, but now we need to turn it into a story. We want the globe to automatically rotate to specific locations as the reader scrolls through your article.
This works by combining CSS (to fix the globe in place) and JavaScript (to detect scrolling).
The HTML Setup (CRITICAL!) You must place your script tag at the very bottom of your <body>. Why? The JavaScript needs to find your text elements (#step-1) to calculate their position. If the script runs before the HTML is loaded, it will crash.
HTML
<body>
   <svg id="viz"></svg>

   <div id="scroll-container">
      <div class="step" id="step-1"> ... </div>
      <div class="step" id="step-2"> ... </div>
   </div>

   <script src="script.js"></script>
</body>
Fix the Layout (CSS) This is the most important part. We need to tell the browser to let us scroll down the page, but keep the globe stuck to the background (like a wallpaper). (Replace your entire style.css with this).
/* 1. Allow scrolling */
body {
  margin: 0;
  padding: 0;
  background-color: #000;
  color: #fff;
  font-family: sans-serif;
  overflow-x: hidden; /* Prevent horizontal scroll */
  /* Remove 'overflow: hidden' so we can scroll vertically! */
}

/* 2. Pin the Globe to the background */
#viz {
  position: fixed; /* ★ CRITICAL: Keeps the globe from moving */
  top: 0;
  left: 0;
  width: 100vw;
  height: 100vh;
  z-index: -1; /* Send it to the back */
}

/* 3. Style the text */
#scroll-container {
  position: relative;
  z-index: 1; /* Bring text to the front */
  padding-top: 100vh; /* ★ Space before the first text appears */
  padding-bottom: 50vh;
}

.step {
  min-height: 80vh; /*★ Give each step plenty of space */
  padding: 20px;
  max-width: 400px;
  margin-left: 50px;
  text-shadow: 0 2px 4px rgba(0,0,0,0.8);
}
The Scrolly Engine (JavaScript) Now that the layout is ready, add the logic to make the globe spin when we scroll. (Add this to the end of script.js)
// ====== Step 4: Scrollytelling Logic ======

// 1. Configuration: Define where the globe should look for each step
const STEPS = [
  {
    id: "step-1",
    rotate: [-73.04, -33.71], // Target Coordinates [Lng, Lat]
    scale: width * 0.8        // Zoom Level (Higher = Closer)
  },
  {
    id: "step-2",
    rotate: [0, -20],         // Reset view
    scale: width * 0.45       // Zoom out
  }
];

// 2. The Engine: Listen for scroll events
function onScroll() {
  const midLine = window.innerHeight / 2; // Trigger line at middle of screen

  STEPS.forEach(step => {
    const el = document.getElementById(step.id);
    if (!el) return;

    const rect = el.getBoundingClientRect();

    // Check if the element is crossing the middle of the screen
    if (rect.top <= midLine && rect.bottom >= midLine) {

      // ★ CRITICAL: Remove any floating labels!
      // If we don't clear them, the city names will float in mid-air while the globe spins.
      svg.selectAll(".city-label").remove();

      // Smoothly transition the globe to the new angle
      d3.transition()
        .duration(750) // Animation speed (0.75s)
        .tween("rotate", () => {
           const r = d3.interpolate(projection.rotate(), step.rotate);
           const s = d3.interpolate(projection.scale(), step.scale);

           return (t) => {
             projection.rotate(r(t));
             projection.scale(s(t));

             // Redraw everything (Land, Ocean, and Flights)
             svg.selectAll("path").attr("d", geoPath);
           };
        });
    }
  });
}

// 3. Start listening!
window.addEventListener("scroll", onScroll);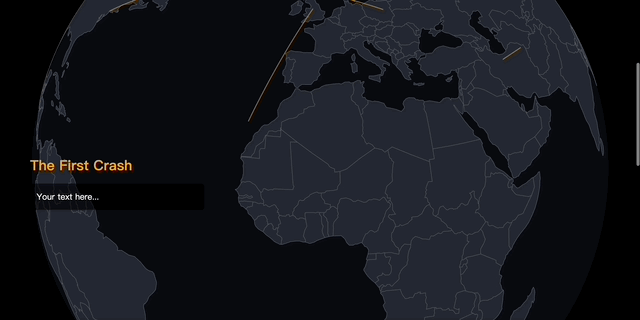
Level Up: The “Frame-by-Frame” Effect
The code above works great, but it feels like hitting “Play” on a movie player. What if we want the user to be the timeline?
To achieve that “Apple Product Page” feel where the animation is perfectly synced to the scrollbar (scrubbing), we need to change our logic. Instead of telling D3 to “transition over 750ms,” we calculate the exact percentage of the distance between Step 1 and Step 2, and force the globe to that exact angle instantly.
Replace your previous Step 4 code in script.js with this:
// ====== Step 4 (Advanced): Scroll-Linked Animation ======

// 1. Scene Configuration
// Define the keyframes: When the user scrolls to a specific HTML element,
// what should the globe look like?
const SCENES = [
  {
    // The HTML element acting as the trigger
    elem: document.querySelector("#step-1"),
    // The Globe parameters for this scene
    rotate: [-116.4, -39.9],   // Focus on Beijing (Start)
    scale: width * 0.8
  },
  {
    elem: document.querySelector("#step-2"),
    rotate: [0, -20],    // Focus on Europe/Global View (End)
    scale: width * 0.45
  }
  // You can add more steps here (e.g., #step-3)
];

// 2. The Engine: Calculate Progress & Update Globe
function onScroll() {
  const scrollY = window.scrollY;
  const screenHeight = window.innerHeight;

  // We want to interpolate between Scene 1 and Scene 2
  const startScene = SCENES[0];
  const endScene = SCENES[1];

  // Calculate the position of the scenes relative to the top of the page
  // We center the trigger point (screen middle)
  const startY = startScene.elem.offsetTop - screenHeight / 2;
  const endY = endScene.elem.offsetTop - screenHeight / 2;

  // ★ The Magic Math: Calculate "Progress" (0.0 to 1.0)
  // 0.0 = We are at Scene 1
  // 1.0 = We are at Scene 2
  // 0.5 = We are exactly halfway between them
  let progress = (scrollY - startY) / (endY - startY);

  // Clamp the value: ensure it never goes below 0 or above 1
  progress = Math.max(0, Math.min(1, progress));

  // ★ Interpolation: Calculate the "In-Between" state
  // d3.interpolate takes a start value and end value, then finds the value at 'progress' %
  const currentRotate = d3.interpolate(startScene.rotate, endScene.rotate)(progress);
  const currentScale = d3.interpolate(startScene.scale, endScene.scale)(progress);

  // Apply the calculated values INSTANTLY (No duration/transition!)
  projection.rotate(currentRotate);
  projection.scale(currentScale);

  // Clean up old labels to keep the view clean
  svg.selectAll(".city-label").remove();

  // Redraw the map and flights
  svg.selectAll("path").attr("d", geoPath);
}

// 3. Scroll Listener with Performance Optimization
// We use 'requestAnimationFrame' to ensure the animation is smooth (60fps)
let ticking = false;

window.addEventListener("scroll", () => {
  if (!ticking) {
    window.requestAnimationFrame(() => {
      onScroll();
      ticking = false;
    });
    ticking = true;
  }
});
Pro Tip: How to find the perfect coordinates?
Don’t try to guess the longitude and latitude numbers! It’s impossible to get right. Instead, use your browser’s console to find them:
- Inside your drag function (Step 3), add: console.log(projection.rotate()).
- Refresh the page and drag the globe to your desired position.
- Open the Console (Right Click -> Inspect -> Console).
- Copy the numbers you see (e.g., [-116.4, -39.9],focus on Beijing) and paste them into your SCENES array in Step 4.
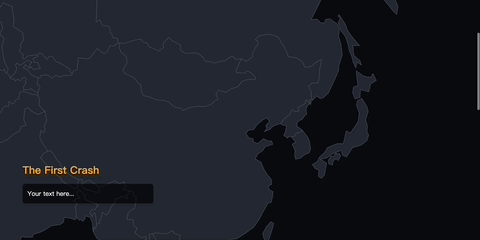
Conclusion: Now It’s Your Story
There you have it. We didn’t just build a map; we built a cinema.
We started with a blank black screen, added a sphere, drew flight paths from a messy CSV file, and finally, we turned the user’s scrollbar into a timeline that controls the camera.
Why this matters: Tools like Mapbox or Google Earth Studio are powerful, but they are “black boxes”—you can only do what they allow you to do. By building this with D3, you own every pixel.
- Want to change the flight paths to shipping routes? Just swap the CSV.
- Want to map Taylor Swift’s tour history instead of plane crashes? Go for it.
- Want the globe to turn red when it spins to a certain angle? It’s just one line of JavaScript code.
Your Next Steps:
- Swap the Data: Download a dataset from Kaggle (migration patterns, bird flights, internet cables) and plug it in.
- Play with Design: Change the ocean color, make the lines glow, or change the font.
- Break Things: The best way to learn is to break the code and try to fix it. If you get stuck, console.log is your best friend (and so are ChatGPT/Gemini/Claude…!).
Now, go spin the world. 🌍🚀

- From CSV to Spinning Sphere: How to Build a Scrollytelling Globe with D3.js - January 27, 2026


