How to make a bar chart with Chartbuilder
Quartz’s digital guru David Yanofsky was tired of building a branded chart every time a reporter asked him. So he built a dashboard so any novice coder could design and tweak their own. Then, Quartz open-sourced the dashboard for anyone to use. (Medium’s developers just released Charted.co which can visualize a spreadsheet you supply to it via URL. It’s worth playing around with, too.)
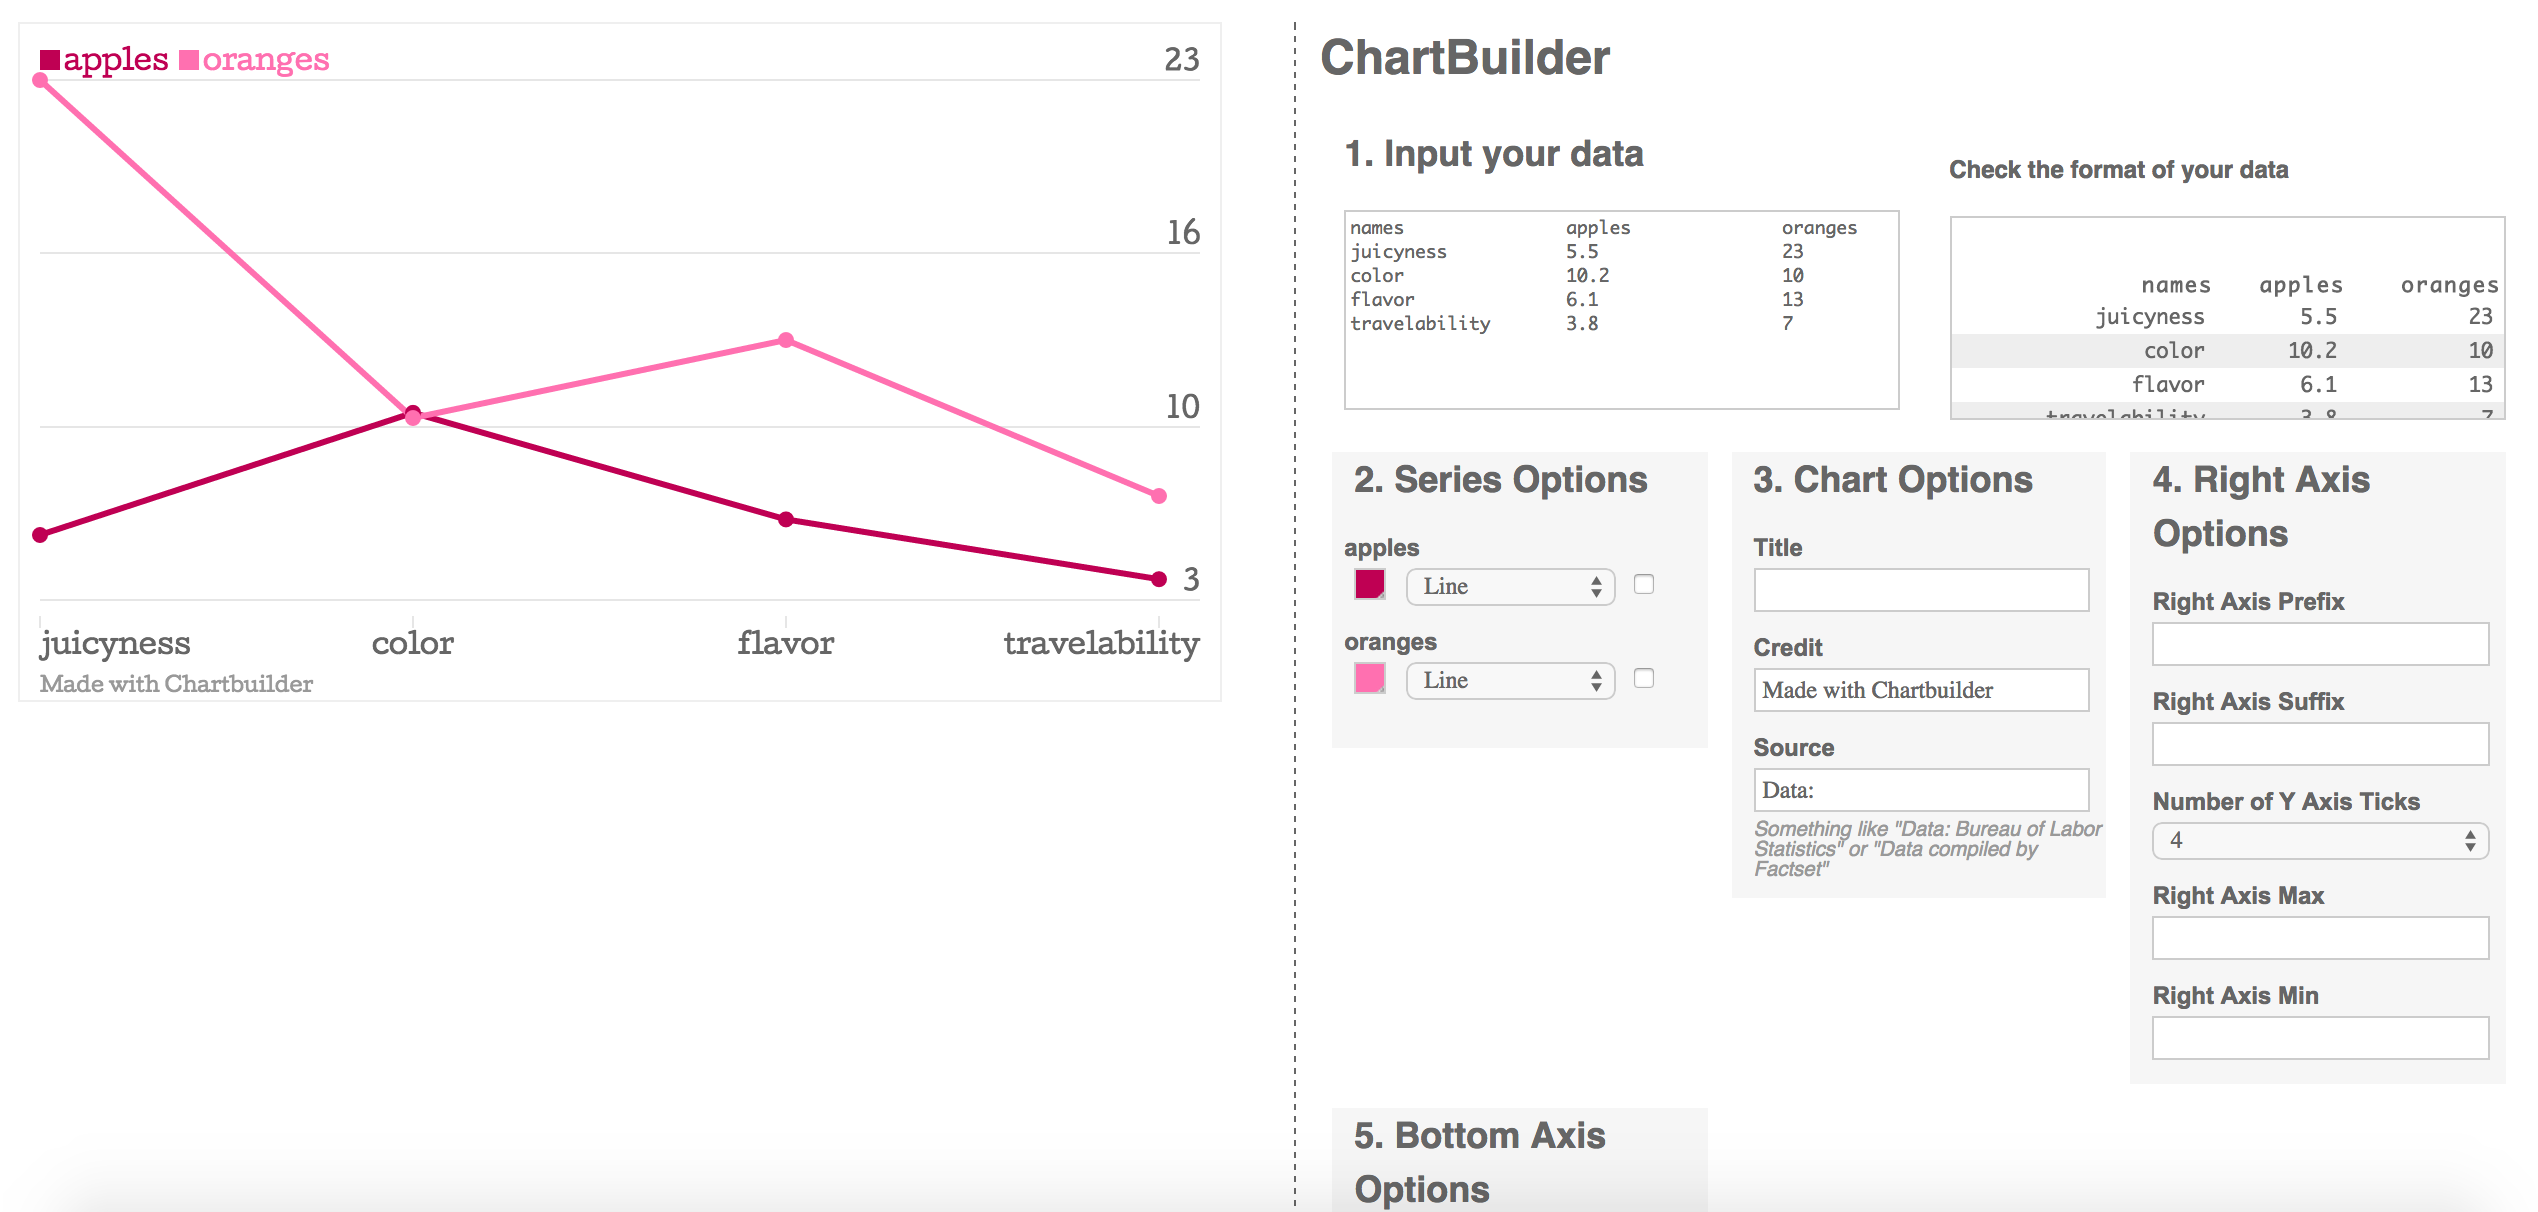
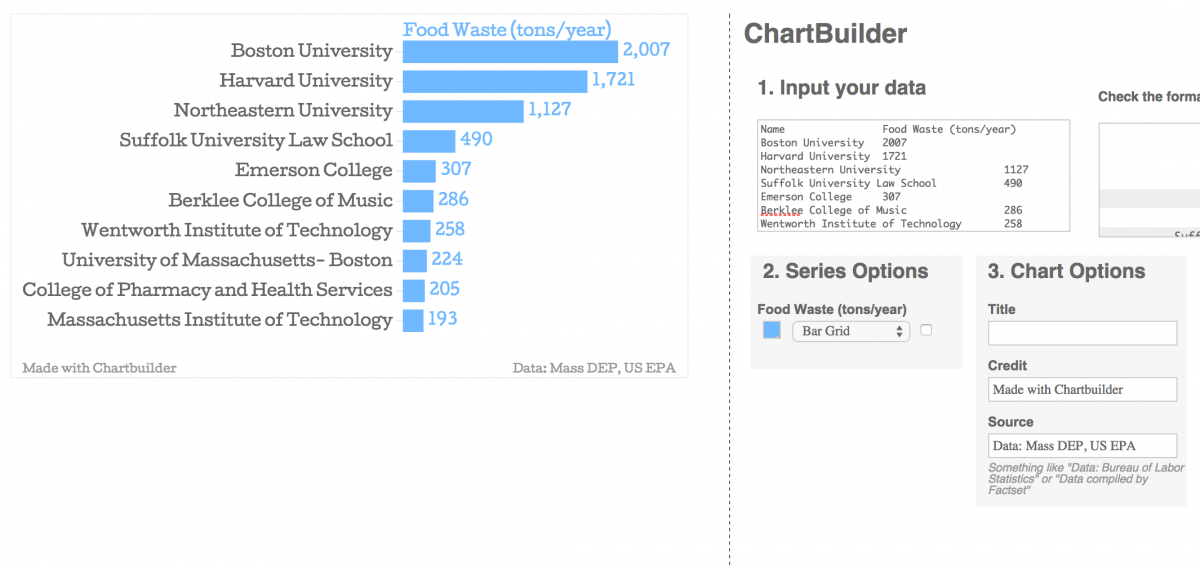
Here’s a chart I built with Chartbuilder.
Top ten colleges in Boston and Cambridge by food waste

Get the data
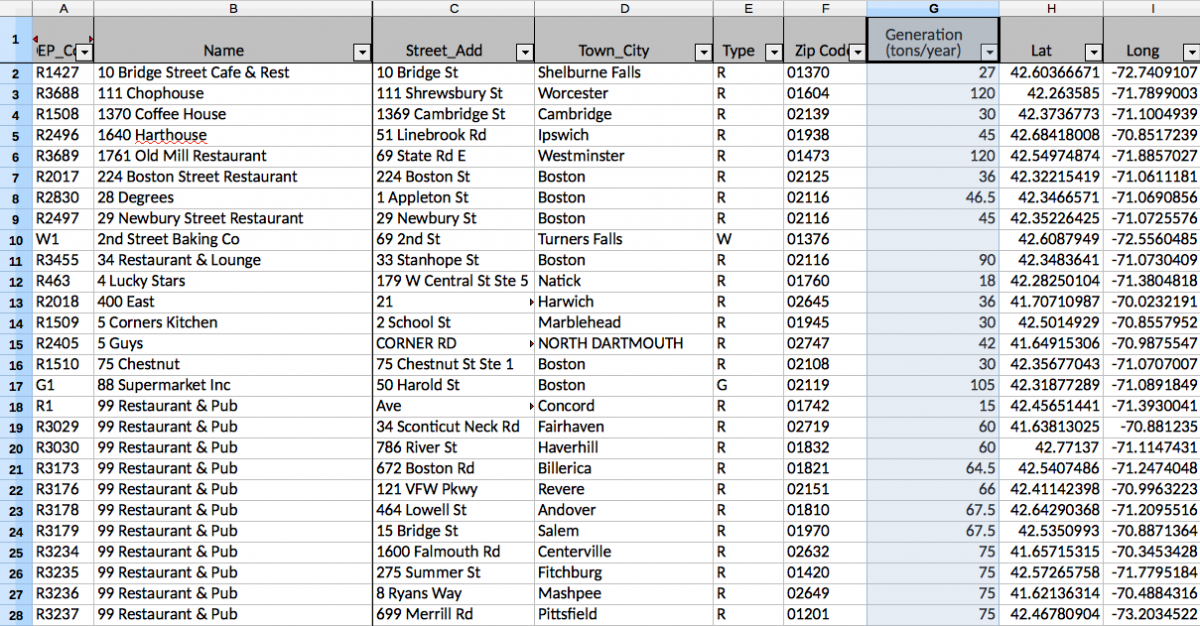
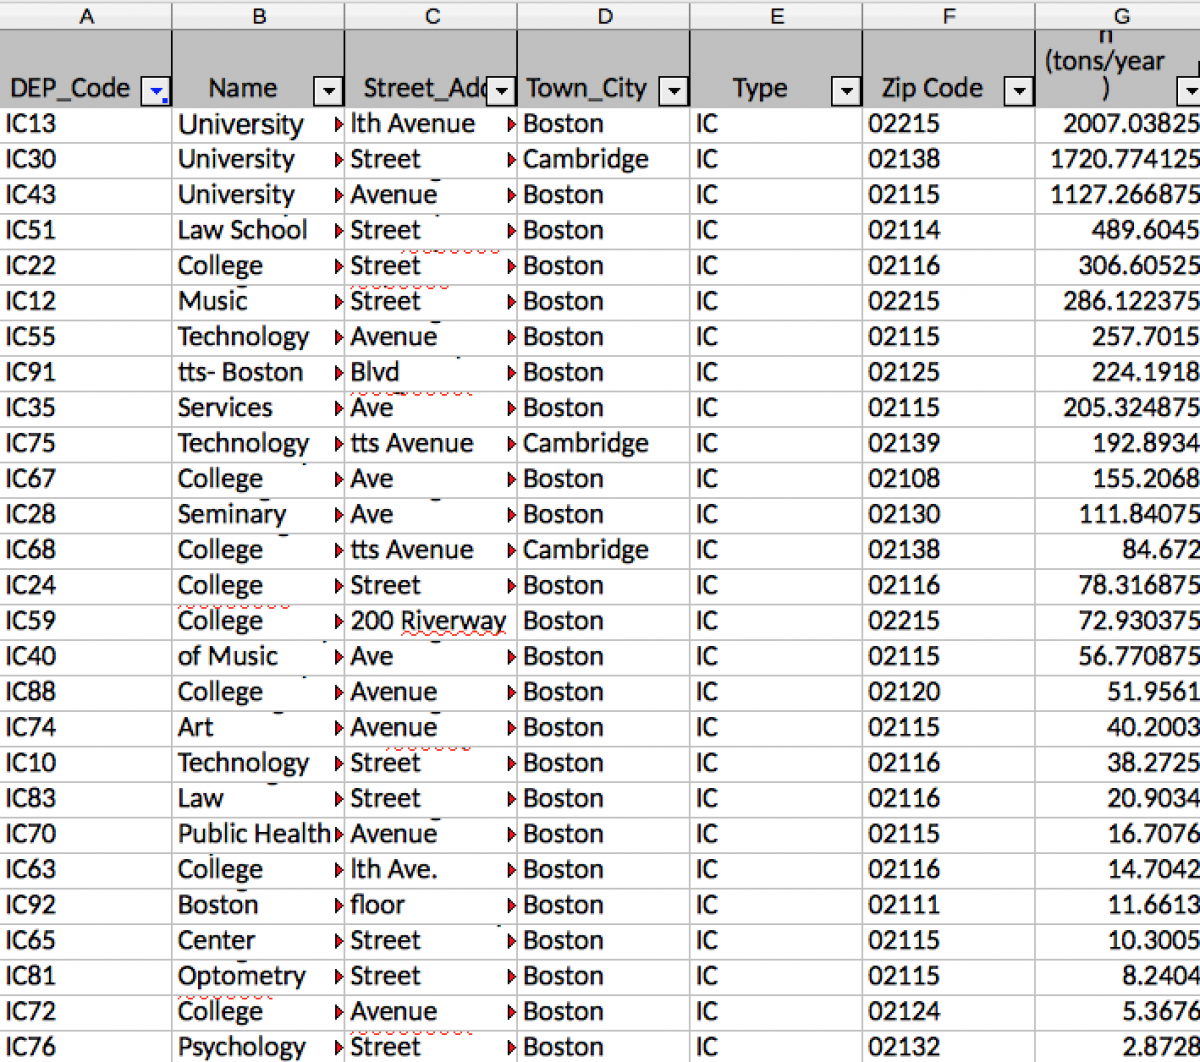
I Googled “filetype:xls Massachusetts food waste” and got a spreadsheet from the Massachusetts DEP that was initially based off an assessment by the US Environmental Protection Agency of Massachusetts food generators. Cool. I use LibreOffice.
Clean the data
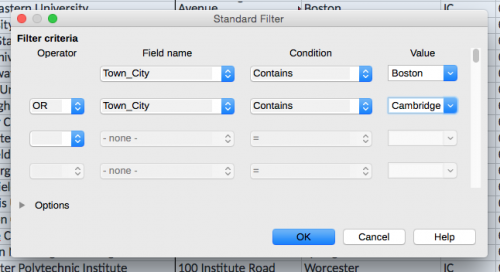
Next, I filtered the list of 6,857 entries down to just Boston and Cambridge.
I copied this into a new sheet and ran another filter for the DEP code “IC” which limits my list to only colleges and universities.
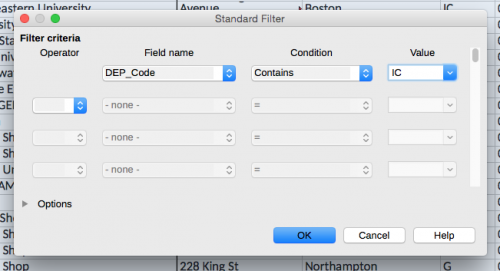
This resulted in the following:
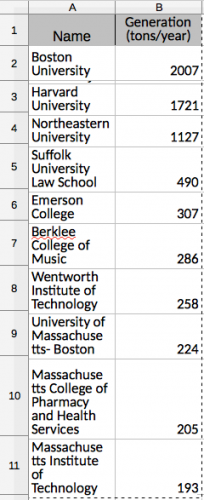
Next, I took the top 10 food wasters by sorting the column “Generation (tons/year).” I copied this into another spreadsheet and hacked off two decimal places by selecting “Format –> Cells.” Voilá, a cleaned dataset:
Graphing it with Chartbuilder
I opened up Chartbuilder in a web browser.
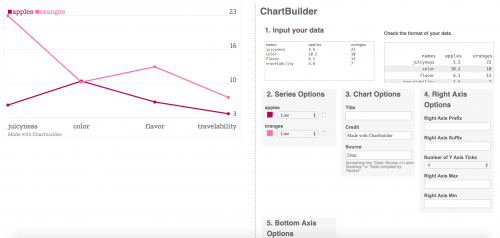
Then I simply pasted in the 11 x 2 table of cleaned data.
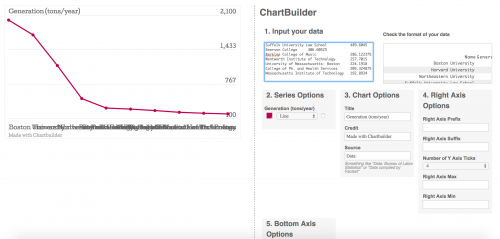
Next, I selected the “2. Series Options” and clicked Chart in the dropdown menu.
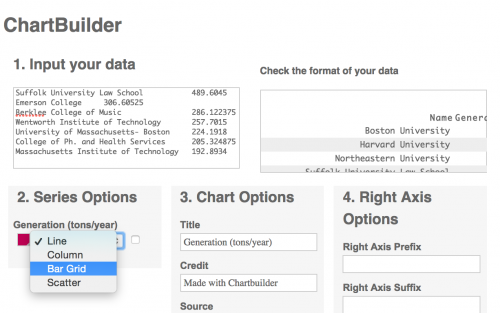
Then I changed the color in “2. Series Options.” Next, I cleaned up the axes and credited the data sources under “3. Chart Options.”
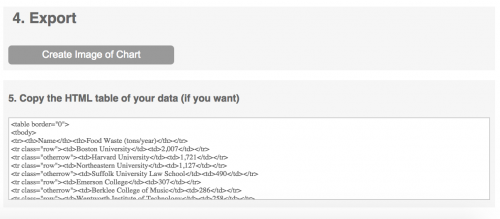
Embedding your chart
Finally, I clicked “Create Image of Chart” from “4. Export” and downloaded a .png file of my chart. Beware: once you close the Chartbuilder tab on your browser, there’s no way of retrieving your information.
Finished product:


