Analyzing the top links, domains, and keywords from 29 million tweets about Covid-19
Today, in collaboration with Lazer Lab at Northeastern University’s Network Science Institute, I published an interactive dashboard exploring the prevalence of Covid-19 news and misinformation on Twitter. The analysis is based on 29 million tweets collected between January 1 and September 30, 2020 from over half a million registered American voters for whom we have demographic attributes like age and political party affiliation.
Some of our top findings:
- While most of the 7 million tweeted links we extracted were to reliable websites, just over 1% were to sites we identify as fake news publishers.
- Republicans and older people were more likely to share links from fake news sites.
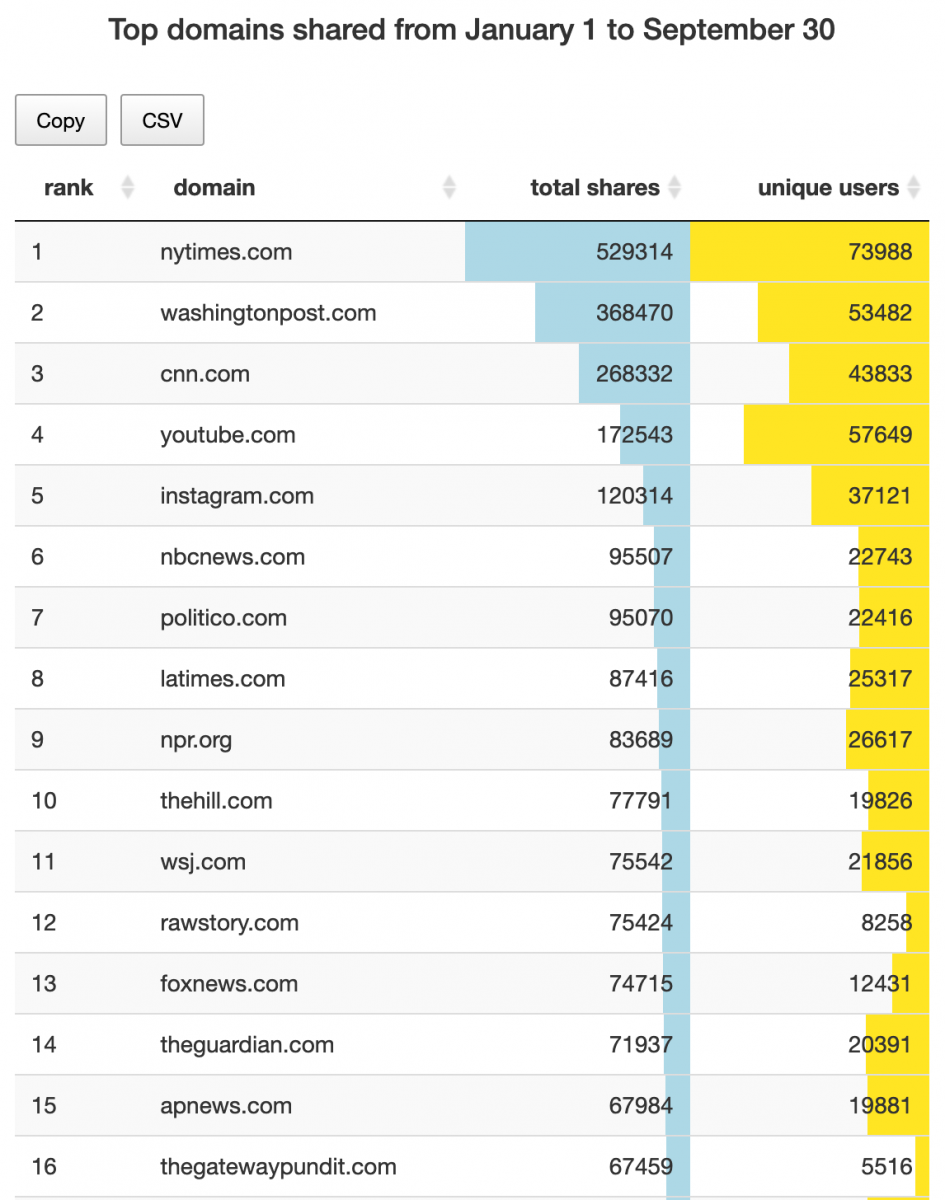
- The Gateway Pundit is by far the most shared website that publishes fake news and is among the top 20 most shared websites overall.
Explore these data yourself using our interactive dashboard. This data set can be analyzed via top links, domains, and keywords and faceted by state. Here’s a brief explanation of the three tabs:
- Top links displays the most shared links, such as news stories and Covid dashboards. Filter the top links either at the national level or for a specific state, as well as by month. For instance, apply filters to answer the question: What links were shared most often by Ohio residents in April?
- Top domains showcases the most shared sites such as “cnn.com.” Aside from exploring top domains shared by state and nationally, there is the option to drill down further by two demographic attributes: by age group and by political party affiliation.
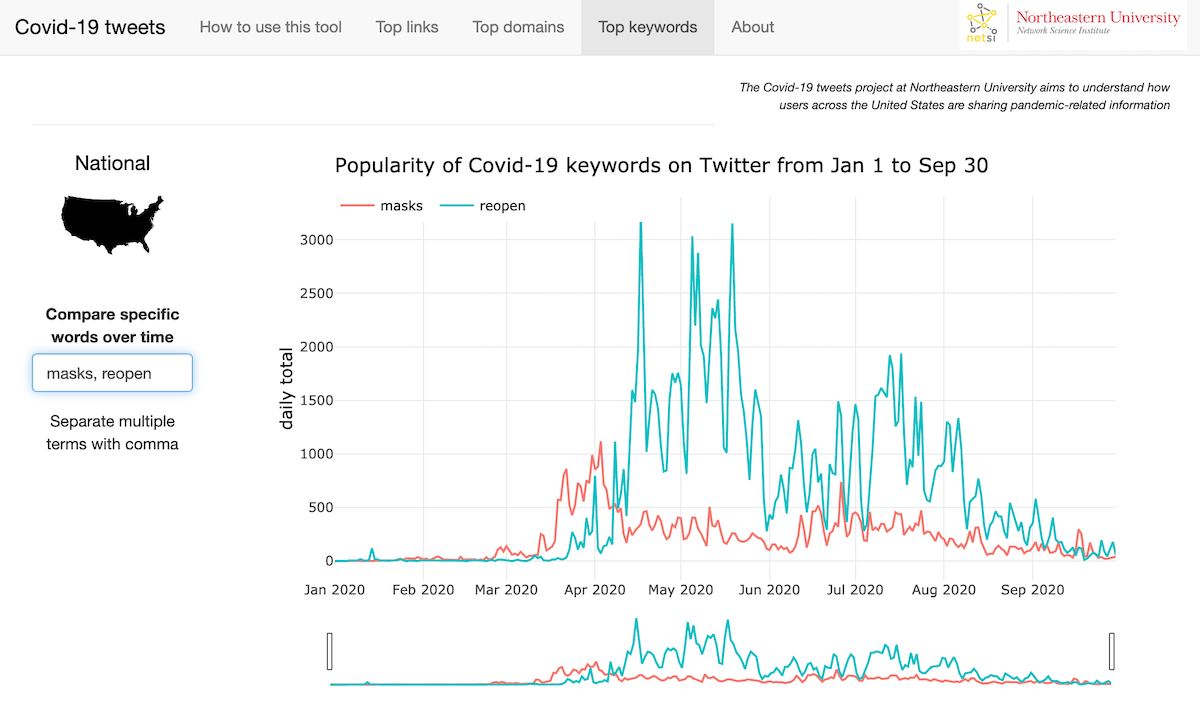
- Top keywords features the most frequently occurring words such as “pandemic.” Explore how popular keywords trend over time and juxtapose those patterns with a media coverage feature which uses the Media Cloud API.
Below is a GIF explaining how to use the app, which is built in R Shiny.

Details on our methods can be found in our “COVID-19 Fake News Sharing on Twitter” report which is published with the The COVID-19 Consortium for Understanding the Public’s Policy Preferences Across States, a collaboration of scholars at Northeastern University, Harvard University, Rutgers University, and Northwestern University.
For additional information and press requests, contact David Lazer at d.lazer@neu.edu, Katherine Ognyanova at katya.ognyanova@rutgers.edu, and Matthew A. Baum at matthew_baum@hks.harvard.edu.


