How Stuff.co.nz told the story of New Zealand’s coronavirus lockdown
Felippe Rodrigues creates data visualizations for stuff.co.nz, New Zealand’s largest online news publisher. One of his recent pieces, “The story of New Zealand’s COVID lockdown, in graphs,” uses smoothly animated computer graphics to demonstrate the effectiveness of New Zealand’s precautionary measures against the coronavirus, while walking the viewer step-by-step through the data.
Rodrigues, a former Storybench correspondent who graduated in 2018 from Northeastern University’s Media Innovation program, fell in love with data journalism and programming during his time at Northeastern. To those hoping to follow in his footsteps and use technology in the newsroom, Rodrigues has the following advice: “Your greatest asset is learning how to learn.”
Storybench sat down Rodrigues to discuss data skills, digital storytelling formats and visualizing Covid-19 data in new ways. This interview has been edited for length and clarity.
How can data visualization help create understanding for people who aren’t data experts?
You’ve got to stop thinking as you and start thinking as someone else who comes into this and has absolutely no idea what they’re looking at. You don’t want to alienate the expert, who really understands what we’re talking about, but you also cannot drive away the person who might at some point be really interested in that type of content. You’ve gotta strike that balance, but especially when you’re introducing something and it’s a little more complex. You’ve gotta walk users how to read that chart, so lots of annotations, or a very well designed legend that tells people what exactly some things are. That works for digital, and I’ve been learning day after day that print needs that even more, because print is static. You’re just showing someone this one thing and it has to be self contained and people have to understand that. So when I’m transforming the digital charts into print charts, I tend to annotate a lot more.
How did you choose the graph you did for this piece?
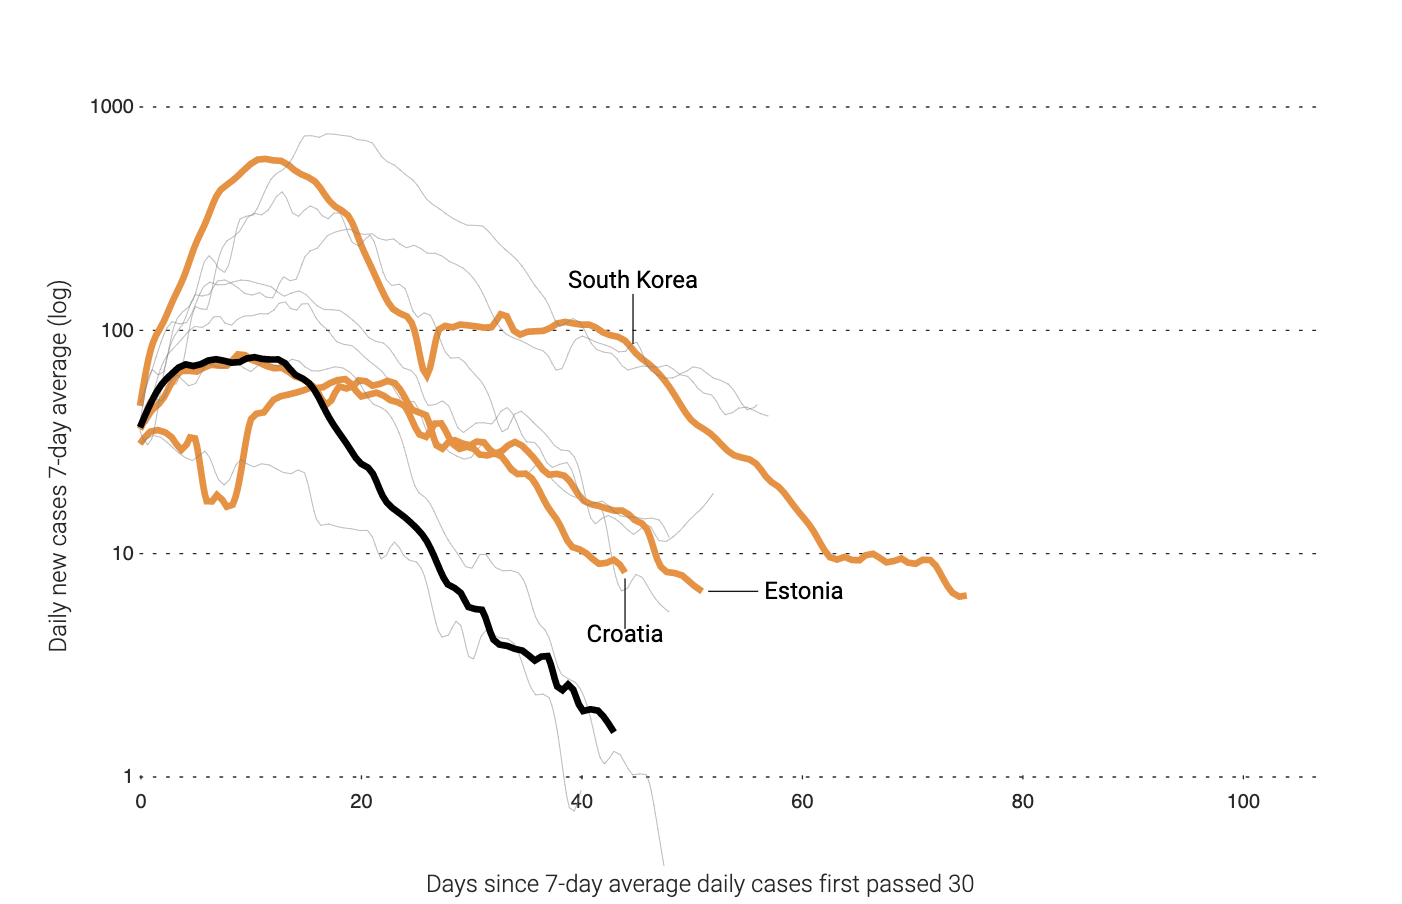
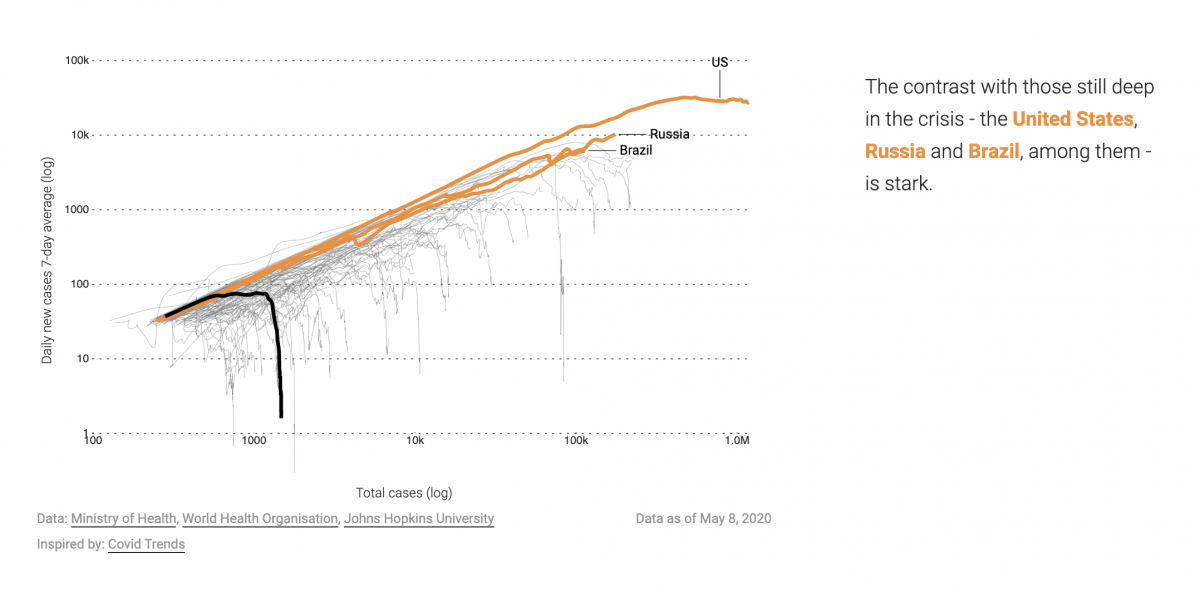
I kinda fell in love with the shape of the thing. Everywhere we were seeing the logarithm scale on the y, and then the time on the x. When things started to plateau (the flattening the curve concept), that became kind of ubiquitous for a while there. When you said, “let’s flatten the curve,” people really understood that you were referencing that graph. And then I saw that [other graph], which was a little change in what we were seeing. Now, you add two log scales to the thing, you forget about time as an axis, and time now becomes an animation. It’s just a very smart view of this data and it visually proves the point. Things are literally dropping, the thing is going down, instead of the flattening curve.
I told my editor at stuff, “I think this graphic is really awesome. And if we explain it a little bit, if we walk people through what’s happening here, we can create a really cool narrative. We start from the thing that everyone is used to, the log chart, and then we transform this with animations into that other chart … this is going to look great as shapes on a form.”
The piece has an interactive feel because it requires the reader to trigger each new element by continuing to scroll. How did you accomplish this?
I think the cool kids call this “scrollytelling.” I first heard of it during one of the classes at Northeastern, Dan Zedek’s class. If you walk them through the first steps, then you can go crazy with the animations and it really helps make a point. It is really useful to add things which show users and point them towards exactly what you want them to see.
I basically programmed the whole thing, even the user interface, the html, the css. All that, I did. And the piece is pretty much powered by Javascript. That’s what makes the animations happen. And also the charts, they heavily rely on one of the greatest things that humanity ever created, which is D3.js, it’s a javascript library. It’s a great tool; it’s one I use a lot. It’s pretty much my programming there, obviously built on top of other people’s programming, javascript, D3, html, and css. I have some other little tools that compile all the things and make them work across browsers.
What is the strategy for telling a data-driven story like this in an ongoing situation?
Trying to report with data and graphics within an ever-evolving situation, I think it’s really important to plan things and develop. Even if you invest some time now, in the long run, it would actually end up saving you time. Instead of wasting 35 minutes every day, compiling the data, putting it on a spreadsheet and then cleaning the data…No. Invest like two or three days up front, and then you’re set for however many months that thing sticks to your coverage.
What advice do you have for early-career journalists or anyone interested in data visualization?
First thing is, you’re going to have to learn how to code. But learning how to program, it literally changed my life. It is awesome, and it’s something that I’m for sure going to be doing for the rest of my life.
Two, you gotta be really, really, knowledgeable about data, data types and how data can be organized. Maybe even before you start to learn how to program, really get good at Excel, or Google sheets. In a way, when you’re starting to write formulas there, you are already programming. It’s not complex javascript or complex Python, but it really creates a good foundation for you to later on understand some problems that might occur.
And then, once you know a little bit about data and are starting to know how to program, my tip is pick your poison. Pick a language, and then pick a problem. Then just figure it out.
It doesn’t have to be beautiful code. You can leave that for later. You’re not writing production code, you’re writing something for you. Even if it’s not a really complex thing, if you figure out how to do something small but cool, it is a great asset on your portfolio when you’re looking for that first internship or even that mid-level or entry-level job.
Any tips for Northeastern students in particular?
Take advantage of the interdisciplinary thing. I took typography classes. I took programming classes there that introduced me to how to do javascript, which is what I use a lot. I think that’s the biggest asset one can have there; going for classes that are kind of outside of your realm. That really expands the things you can do in journalism. I think it’s the future of journalism, bringing all those things back to how we tell stories.
- How Stuff.co.nz told the story of New Zealand’s coronavirus lockdown - October 30, 2020


