How to build a GIF of satellite imagery in R
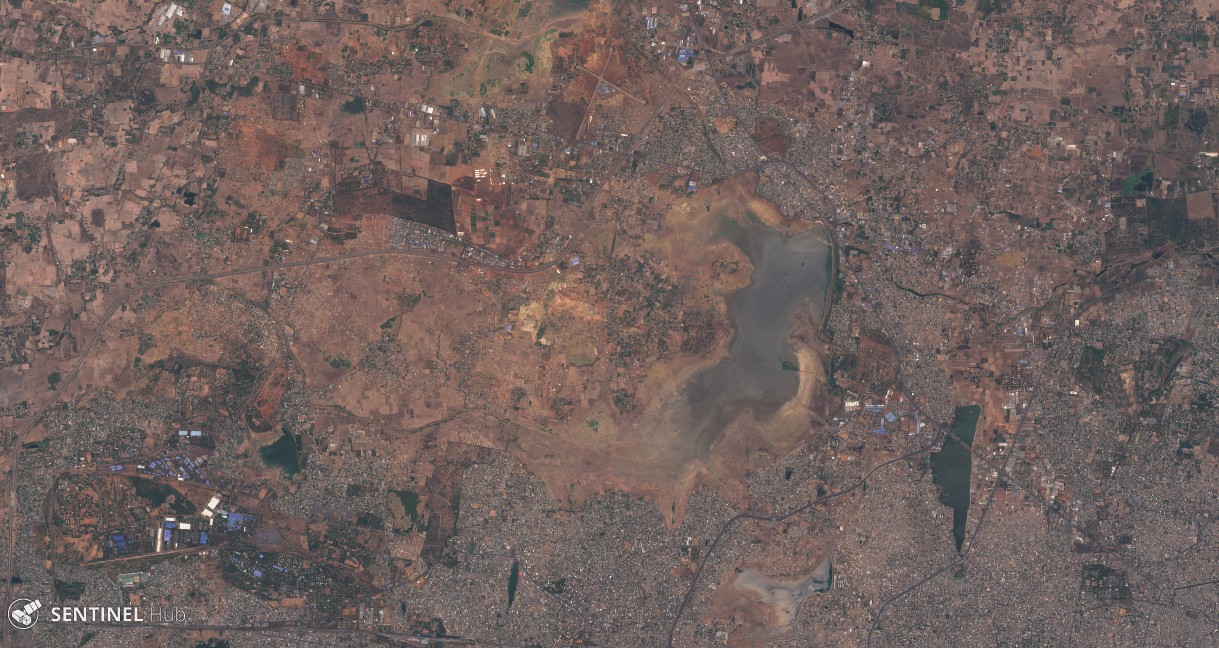
“The timelapse imagery of Chennai’s disappearing reservoirs is mind boggling,” Earther senior reporter Brian Kahn wrote on Twitter recently. Kahn had just published the piece “Why Chennai, India’s Sixth Biggest City, Has Run Out of Water” which was accompanied by several GIFs of the city’s vanishing reservoirs.
When asked how he’d built the GIFs, Kahn pointed Storybench to the European Space Agency’s Sentinel Hub, which allows users to explore satellite imagery. The Sentinel Hub Playground service is especially user-friendly, letting users quickly access and visualize Sentinel-2, Landsat 8, DEM and MODIS images.
Below, we’ve attempted to recreate that animation of Chennai’s disappearing Lake Puzhal reservoir using Sentinel Hub and RStudio. The process and code below could be used for countless other animations to show, say, dam collapses, deforestation, forest fires and more.
By the way, if you’d rather not use R, you could use Sentinel Hub’s EO Browser to create a GIF with their user interface. Scroll down to the bottom of this post for details.
Note: For an introduction to R and RStudio, check out these tutorials.
Downloading the satellite imagery
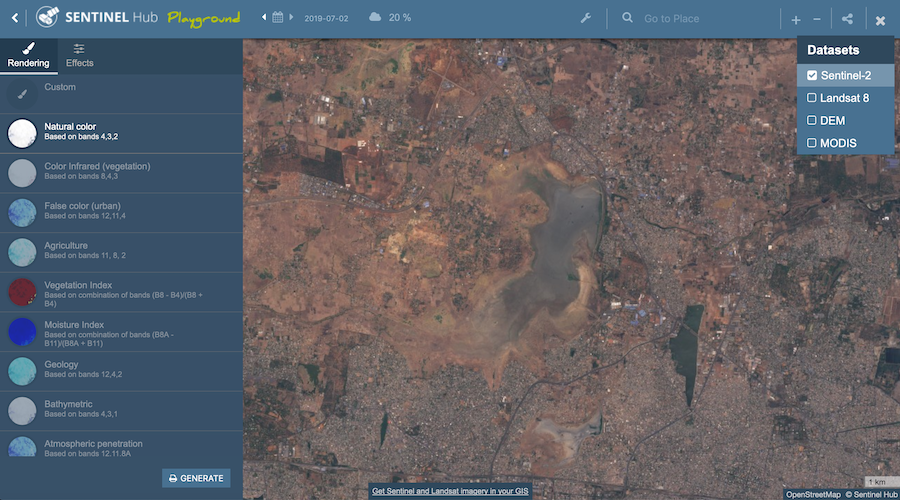
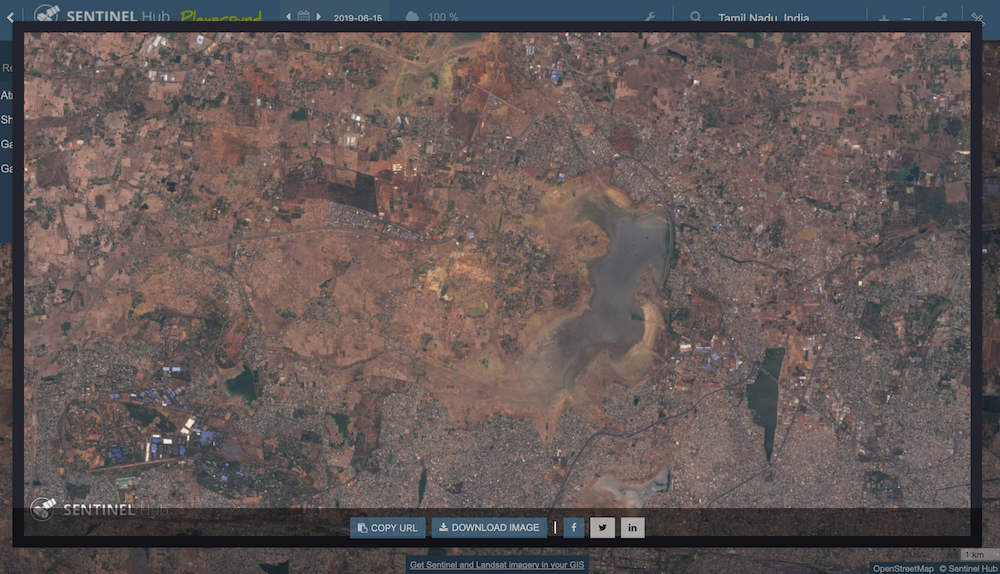
After navigating to Sentinel Hub Playground, type “Chennai, India” into the search bar and drag the window over to the reservoir of interest. Make sure you have “Sentinel-2” selected under Datasets on the top-right and “Natural color” in the Rendering tab on the far left.
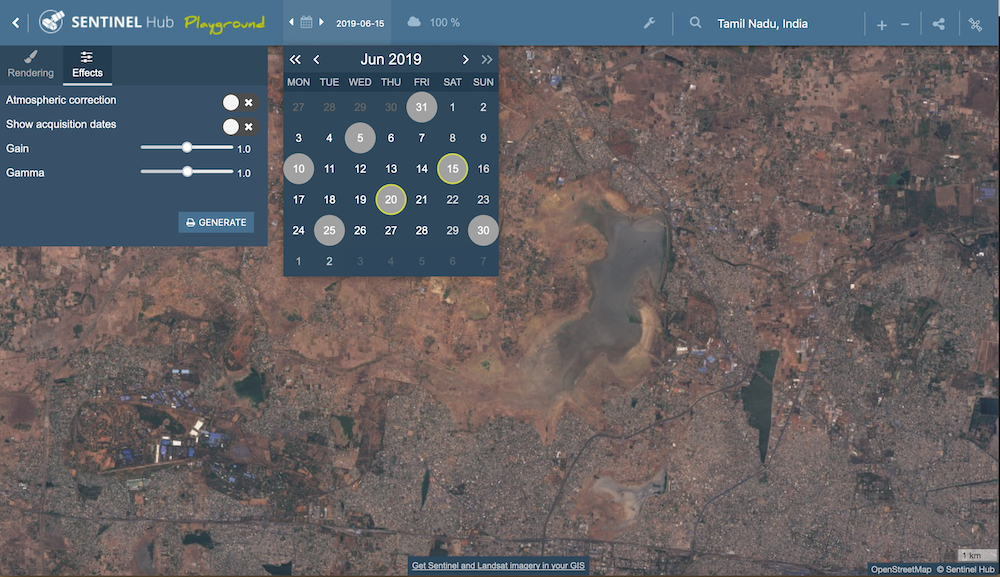
Select the calendar icon on the top nav bar and start looking through the images available of Chennai.
Once you’ve landed on an image you like – ideally without much cloud cover – click the “Generate” button on the bottom-left and the pop-up window will have a “Download Image” button. Click it.
I ended up downloading 15 JPGs – from 2018-06-15 to 2019-06-15 – after clicking through the intervening months and finding the least cloudy days. I kept Playground’s file naming structure, which looked like: “Sentinel-2 image on 2018-06-15.jpg” and saved them all to a folder I could navigate to in RStudio.
Animating JPGs in R using “magick”
Next, thanks to an awesome tutorial from ecologist Ryan Peek, I knew I could import the files into RStudio and create a GIF using the R packages “dplyr” and “purrr” for data wrangling and “magick” for image processing.
It was as easy as plug-and-play: You tell RStudio where the files are, then read them in, then join them, then give the GIF a title like “Lake Puzhal, Chennai: June 2018 – June 2019,” and then animate the GIF at a frame rate of 4 fps.
library(dplyr)
library(purrr)
library(magick)

chennai_gif <- list.files(path = "chennai/", pattern = "*.jpg", full.names = T) %>%
    map(image_read) %>%
    image_join() %>%
    image_annotate("Lake Puzhal, Chennai: June 2018 - June 2019", location = "+10+10", size = 20, color = "white") %>%
    image_animate(fps=4) %>%
    image_write("chennai.gif")
Finally, head over to your working directory and you should have your chennai.gif. Worked like a charm.
More details and tutorials on the incredible “magick” package here.
Exporting a square GIF for social
Using the image_crop() function, you can crop your GIF and scoot over using the two “+” arguments. More details here.
chennai_square <- list.files(path = "chennai/", pattern = "*.jpg", full.names = T) %>%
  map(image_read) %>%
  image_join() %>%
  image_crop("500x500+450+125") %>%
  image_annotate("Lake Puzhal, Chennai: June 2018 - June 2019", location = "+10+10", size = 16, color = "white") %>%
  image_animate(fps=4) %>%
image_write("chennai-box.gif") 
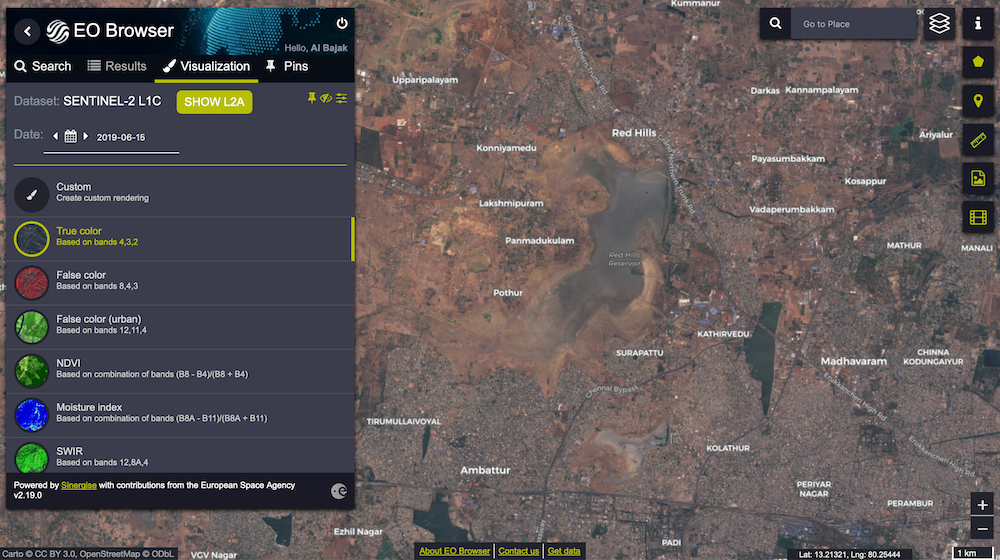
Using Sentinel Hub’s EO Browser to create GIFs with no code
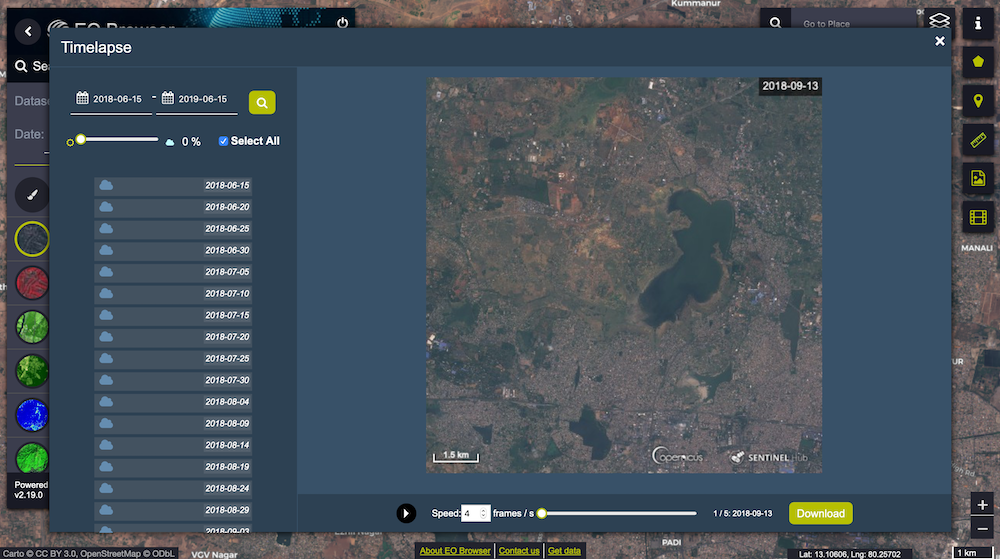
Watchdog group Bellingcat has a great tutorial for using Sentinel Hub’s EO Browser. Basically, you get a free login, head over to your area of interest and click the “Create timelapse animation” icon on the right.
Then, you select your dates and amount of cloud cover – I chose 27% for the below GIF – and export the file by clicking “Download.” Easy.
Final GIF looks like:
More satellite imagery datasets
- NOAA’s Hazard Mapping System and Emergency Response Imagery
- NASA and NOAA’s GOES system (as used in these Washington Post and New York Times graphics.
- Google Earth Engine
- NASA’s Worldview service
- NASA’s MODIS and VIIRS images
- Digital Globe’s Open Data Program
- Microsoft’s 125 million building footprints
- Global Forest Watch
More “geojournalism” resources
- David Yanofsky’s 2018 NICAR talk on satellite imagery
- GIJN’s great list of resources, talks, papers and datasets for satellite imagery


