How the Financial Times built an interactive app to calculate what parts of your job will be automated
Earlier this year, the Financial Times published a story that examined the impact artificial intelligence will have on jobs. Using data from the McKinsey Global Institute, FT created an interactive app that calculated the chances one’s job would be automated in the future. The designed and deployed the interactive in the space of a week.
Storybench asked Joanna Kao and Claire Manibog, a data and visual journalist at the Financial Times, respectively, about how they tackled the project on such a tight deadline.
How was this story pitched?
Manibog: It was part of an internal digital fellowship program sponsored by the FT and Nikkei. Our colleague Robin [Kwong] was this year’s FT fellow and he came up with the idea of a calculator. Our challenge was to turn it into a logical framework that would be usable by the average person.
Joanna was the brain behind the development of the calculator and the mechanics behind it, abbreviating the robust dataset and [labor] statistics. I worked as the project manager, making sure we could accomplish it in a very short timeframe, which was essentially a week.
It started with a story without necessarily focusing on the format. It created a model on how we should approach digital projects like this, either data-driven, graphics-driven or interactive.
During brainstorming process, what did you want to achieve for the project?
“It started with a story without necessarily focusing on the format.”
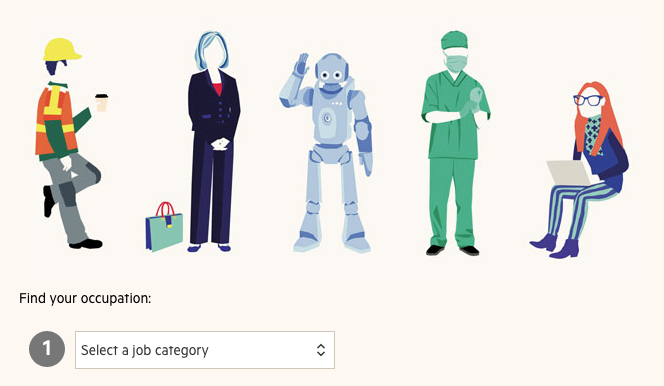
Kao: Our main goal was that people could find their jobs. The Bureau of Labor Statistics (BLS) on jobs is notoriously unintuitive for most human beings. You can’t use BLS straight out of the box. We had to figure out a way to simplify it.
What were the different stages of the project’s creation?
Kao: Something we did early on was to make sure we made some deadlines. Projects like this could actually drag on for months and you wouldn’t necessarily get a better product in the end. We discussed how long we would need and we set up the schedule.
Manibog: We knew we had a week to work on this, which was very ambitious. That time constraint ultimately helped us focus on what was important and make decisions quickly. My approach to this was not to focus on getting something perfect. Setting up the deadline was the first step. We set goals in half-day increments, rather than taking as much time as we needed to get it right.
“On the first day, our morning goal was to user test before building anything. We went out on the street.”
On the first day, our morning goal was to user-test before building anything. We went out on the street, asked people to look at our paper format of the dataset and find their jobs. We quickly realized that most people had a really hard time finding their jobs. All our assumptions that people would be able to navigate the dataset were not working. We had to fix it by the end of the day, in order to start day 2 in the right place.
What was your biggest challenge?
Kao: The hardest part was figuring out the user interface to get people to pick their jobs. It was also the most important thing, so we spent the most time on it – simplifying it. It’s essential for our audience to understand the story.
How to improve user experience?
“We set goals in half-day increments, rather than taking as much time as we needed to get it right.”
Manibog: For an interactive project, at the initial stage, we would take paper and pencil and literally draw things, to express our ideas as quickly as possible, and then we would show it to people in the newsroom. For a small team working on a big project, we relied on the breadth of skills we each brought to the table. Each of us have our own specialization — coding, designing, writing, editing — but we all took on each of those roles at some point or another.
How did your team organize the data?
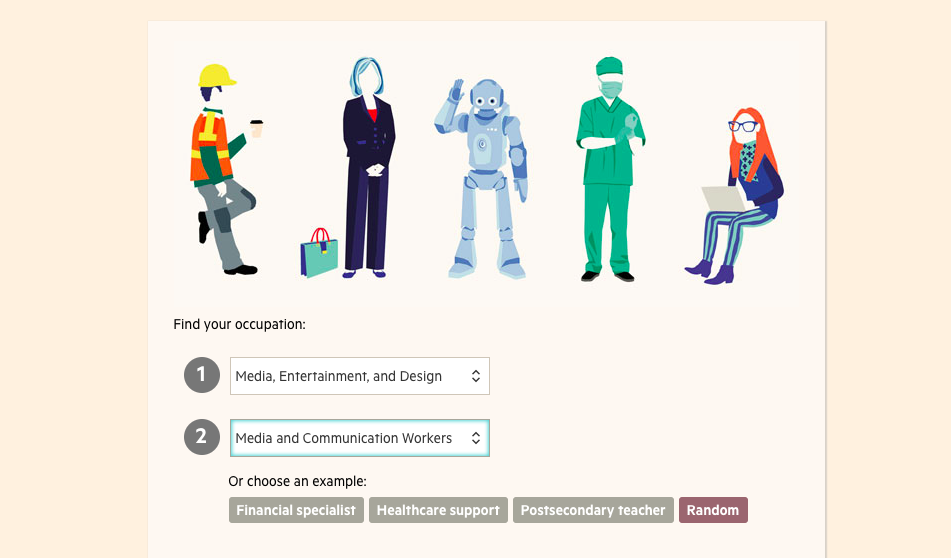
Kao: We took every single job, grouped them into minor categories, and then grouped them by major categories. We also rewrote those labels to make them more intuitive to people.
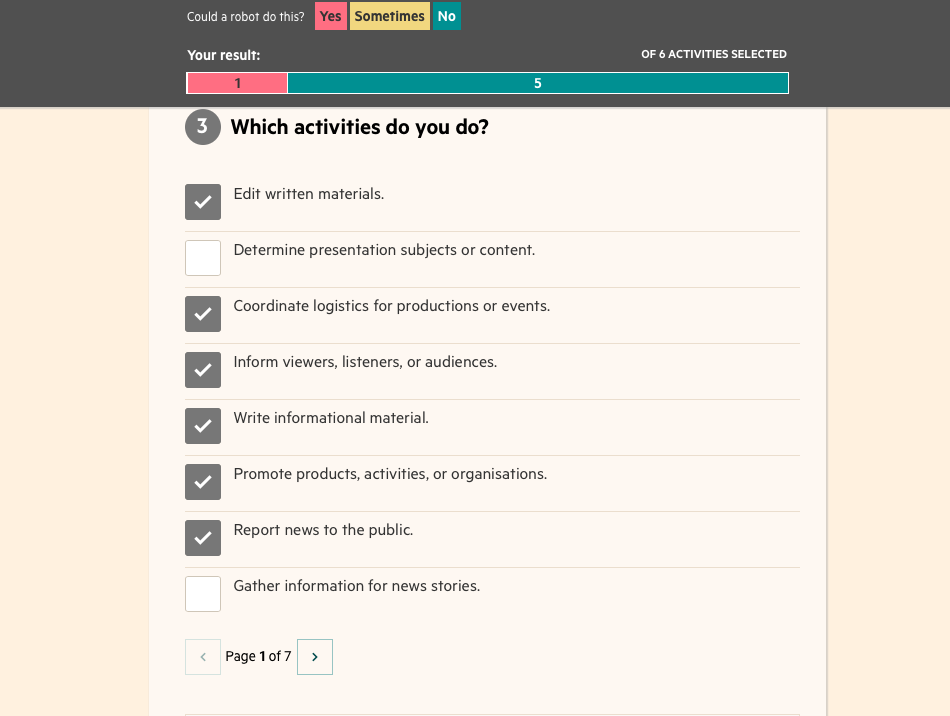
For every single job, we had 30 or 40 tasks associated with each other. After choosing your job, you could also choose what task you were performing for your job. We had to come up with a way to summarize the jobs based on what the [users] have selected themselves.
Manibog: One takeaway from the BLS data is the user test, which meant getting out of the newsroom and asking real people. In many graphics and interactive projects, there’s a common assumption that a lot of the effort goes into building the fancy part, the design or the web development. But these projects require more time in the thinking and researching process at the beginning.
What tools and techniques were used for the project?
Kao: For project management, we used Trello to keep track of what everyone was doing, what components still needed to be done, etc. For collaboration we used Github, so all our code was there. We also used issue and pull requests to add comments.
Manibog: For design, we used a lot of paper. On the first day, three of us all sat down and independently made our interface for 15 minutes. Then we came back, talked about it, and made other iterations. We printed a lot, so we could bring something physical out to the street to different people. Then we used Adobe Illustrator for the mock up.
Kao: On the tech side, it’s just CSS, Javascript, HTML.
Do you have any advice for journalists trying to pull off these kinds of projects?
Kao: In digital world, things improve so quickly and you are always expected to learn. Figuring out how to connect the things you like with things you want to learn could be really helpful. If you want to learn how to make a chart, or how to organize data, maybe find a dataset on something you care about. If you are a student, try everything and don’t be afraid to fail. It’s the best time to learn things, to experiment and try cool things. Once you are in the real world, failing is a lot harder.
“If you are a student, try everything and don’t be afraid to fail. Once you are in the real world, failing is a lot harder.”
Manibog: You absolutely have to have the learning ability, like Joanna said. Be agile and be able to learn things. Don’t feel like you need to be someone that you are not. It’s important to be passionate about your work. In digital storytelling, we have to think of our readers as users. We have to take into account how they would interact with our work. It’s not about writing stories for them, but rather how a story should be told. Think about how you can meet the user’s need while telling a story.
Is a technical background important for a journalist?
Manibog: Yes and no. It’s easy to get caught up by the pressure of having technical skills and forget the basic journalism skills, including knowing how to tell a story.
Kao: The most important skill is communicating with different people, which hopefully is what you’re good at as a journalist anyway. You don’t necessarily have to know how to use something, but you have to be able to understand and respect people who are doing this and work with them.
This post has been updated to correctly attribute quotes.
- Social media and news: The dilemma of our time - January 18, 2018
- How the Financial Times built an interactive app to calculate what parts of your job will be automated - October 10, 2017


