How Axios mapped the “fading fortunes” of the Islamic State
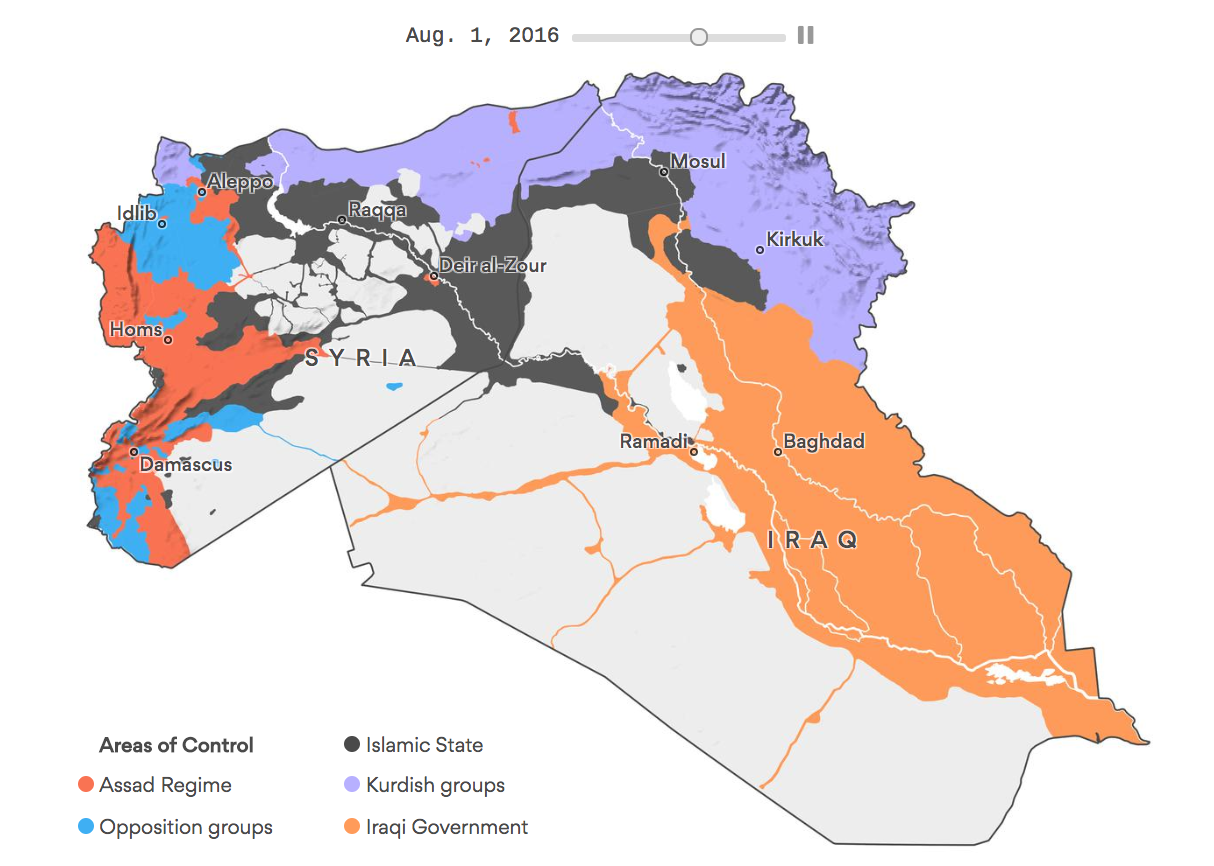
Over the past two years, troops controlled by Syrian president Bashar al-Assad, various Kurdish groups, several opposition groups – with support from the U.S. government – as well as forces dispatched by the Iraqi government have been fighting the Islamic State to regain control over regions in western Iraq and eastern Syria, of which the most important ISIS stronghold is the city of Mosul.
In June 2017, in order to illustrate the “fading fortunes” of the Islamic State, the news organization Axios created several maps of the region. The piece is short – like most of the stories on Axios – but it gets quickly to the point by animating several maps showing ISIS’s shrinking control.
Lazaro Gamio, visuals editor for Axios and a former graphics editor at The Washington Post, shared some thoughts with Storybench about creating graphics to accompany news stories.
How was this project created? Did it start as a conventional written story or was the idea to make this a multimedia piece from the get-go?
I had worked with the IHS Markit data before when I worked at The Washington Post and knew that it was being updated weekly. Once we reached an inflection point on how the media was covering ISIS, we decided to create the map using IHS’s data to show the Islamic State shrinking and being pushed back.
What tools and techniques did you use to build the map?
Once I gathered all the data, I used QGIS, which is an open-source geographic information system (GIS) and exported out all of the images [find QGIS tutorials and tips here]. I then animated all of the images together using JavaScript. The key was that I exported out the territory lines, the mountains, and the borders all separately before composing them all using the Python Imaging Library (PIL). That way, I didn’t have to re-export all of the territory lines once I was happy with the mountains.
What were the biggest challenges with this project?
The biggest challenge was the pure production of the map. After all, there are a million ways to do anything nowadays. I chose to export out a bunch of images from QGIS, which was just laborious, doing things over and over again. All in all, it took me about three days to finesse the production end of things; where I wanted the labels to be and how I wanted everything to blend together.
If you could redo this project, would there be anything you would incorporate this time?
I’m really happy with the outcome and how simple it is: this project was about surfacing the available data. I think what makes it unique is that everyone has been using this data, but no one has animated it over time. That is the value of this map; the information is out there, it was just about picking out which data I wanted to animate.
What did you want the readers to take away from this project?
For this project I wanted the readers to see that the Islamic State was being pushed back and I think that the map does that pretty well. The graphic starts in May 2015 and ends in June 2017 and you can see ISIS’s territory getting smaller over time. There are a couple of design decisions that went into it; one example being that the graphic automatically plays once it is loaded. The headline and the article itself support the overarching theme and this is central to how we create content at Axios. Everything we do has a single clear point and the content is tailored to drive that forward. Everybody has this data, but Axios is about “smart-grevity”: how can we tell you what is happening in a way that is nice and quick where you can walk away feeling smarter and more informed than before.
Where does your inspiration for stories come from?
A lot of my work is about following the news and knowing what data is out there and how it can be extracted and packaged so that it makes make sense for people. A lot of times it does not work, where you can’t use the news to create anything that is really worthwhile. For those times where you can, you just have to seize on the opportunity and use it.
“A lot of my work is about following the news and knowing what data is out there and how it can be extracted and packaged”
“A lot of my work is about following the news and knowing what data is out there and how it can be extracted and packaged”
How important do you believe Twitter has become to attract viewers to your stories?
For me it’s less about getting people to click on my content, it’s more about showing them something interesting. I think people know when you are trying to trick them into clicking on something. Most of the times when I post my stories on Twitter, I don’t really need to include a link. If I do post the link, the reader will get extra stuff. I just like to share content that I make; it’s a good feedback loop. At the end of the day it comes down to making interesting work that is thought-provoking and I strive to do that with all my stories.
What would you say to young journalists that aspire to do similar work in the future?
I think you should experiment as much as you can, never say no and just keep working. I believe that with anything you start doing there is going to be a time where your work will suck. The trick is to never give up, there will be a time where your taste is going to be bigger than what you can actually accomplish and you simply have to keep working until you produce content that you like.
- How Axios mapped the “fading fortunes” of the Islamic State - October 6, 2017


