How The Pudding visualized the evolution of “wonky” grooves
Have you ever wondered how the beat of a song can emote? Or how the transcendent nature of loose grooves can make your body want to move? The Pudding’s “Wonky” explores exactly how rhythm and grooves broke out of their traditional boxes.
Journalist and musician Michelle McGhee used her background in computer science to create interactive stories with both visual and audio features. In “Wonky,” her first solo byline at The Pudding, McGhee uses data visualizations to immerse her readers in the fascinating world of irregular grooves.
Storybench interviewed McGhee to learn about how this story was created.
This interview has been edited for clarity and length.
What sparked your interest in this project?
McGhee: I really like music so I had a couple ideas in this realm, of breaking down something in music that maybe you didn’t notice and explaining why it’s working and what it’s doing. That type of story is interesting to me.
I was listening to a talk by a musician that I enjoy, and they were discussing irregular grooves, and he specifically gave this metaphor of a samba group that “rolls like an egg.” He described it as having a weird tilt to it, where it’s not perfectly regular. A little wonky.

How did you decide the format and presentation of this article?
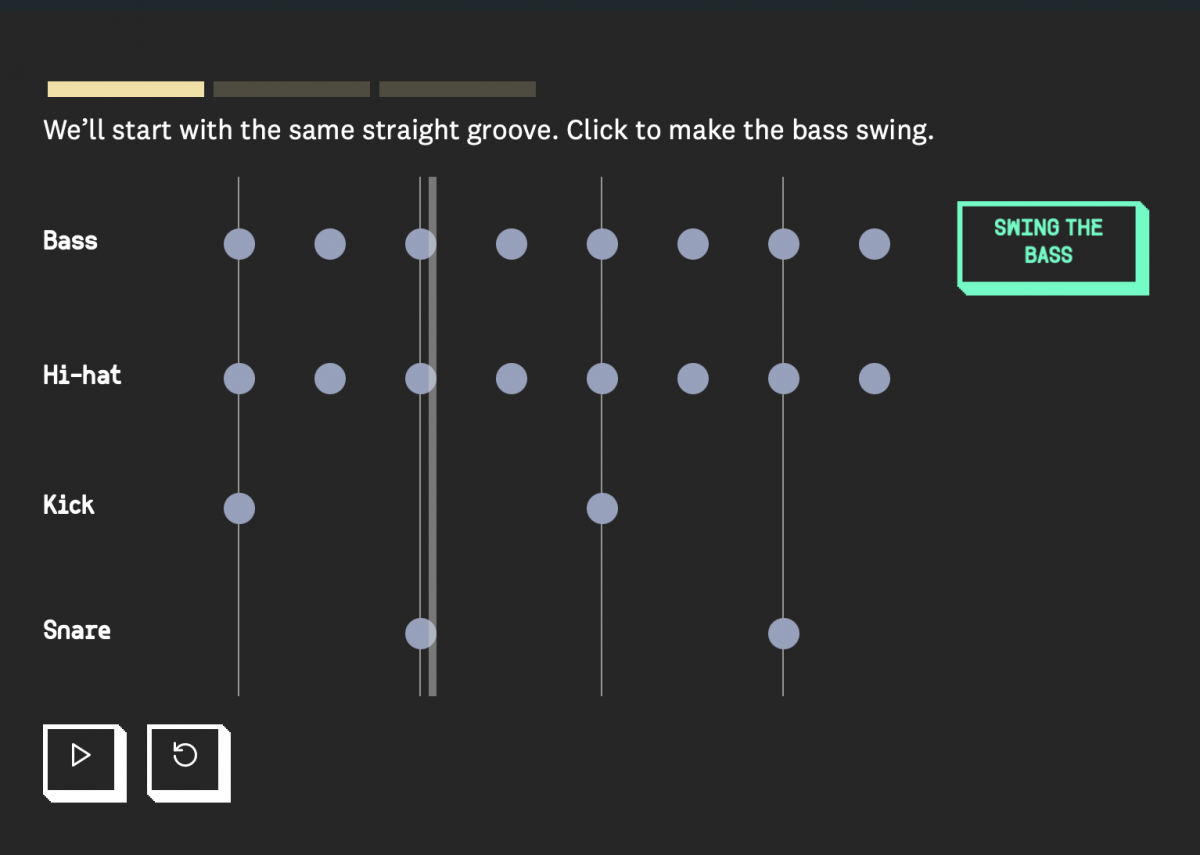
I went down a lot of rabbit holes in trying to figure out what the core visual is that’s showing each beat, as well as how you’re following to see how things are changing and where things are irregular. I had a million different ideas trying to make it all such different things. In the end, this is the most basic way I could have thought to visualize the story.
It looks like GarageBand where you would put notes, and I thought that it might be too boring. I had all these other ideas like a circle, but in the end, those weren’t quite making sense. So, I returned to what is a simpler way of showing the story which is also very effective and that’s fine, it doesn’t have to be fancy and groundbreaking. I initially wanted to invent a new visual for this type of story, however there’s a reason this is how GarageBand works; it’s effective.
What storytelling elements did you prioritize to enhance your readers’ experience?
It’s paced kind of slowly, so you can step through it at your own pace. You get to step through the groove at a pace you can track, which is helpful for explaining complex topics.
There’s this part that’s like, “Let’s get in the weeds about swing,” which is an aside, and for a while that had been a big part of the piece, a piece I wanted everyone to step through. Later, I determined it was actually pretty complicated. It requires some prior understanding and is not central to the core message of the piece. If you’re a music nerd and you want to know about that stuff, it’s really cool. But for someone who doesn’t have that background, it’s a little overwhelming.
From getting that feedback from different types of readers, I ended up making it an opt-in piece. If it’s something you like, you can open it. If it doesn’t sound fun, it doesn’t even open and it’ll stay there. That was a goal, of having both types of people be able to enjoy and understand the story.
What were some difficulties you had in presenting this story visually?
This project took three months or so for me to make and it was a long process. It was significant because it was the first piece at The Pudding I made entirely by myself. I’d done a lot of other pieces where I collaborated with other people. I wanted to challenge myself to execute all the pieces of my idea.
That can be really hard. I had my teammates to give [me] feedback at certain points, but there were a lot of periods where I wasn’t sure if I was even still interested or what to do next. It was just me having to do it, having to decide when it’s done and having to make storytelling decisions, which can be really overwhelming.
I think that at my job at The Pudding, which is really amazing in a lot of ways, that’s the most challenging aspect because we are a small team, so things aren’t as highly structured as they are at other newsrooms. It’s very open and free and I can kind of do whatever I want to do. We’re also all remote, which is really nice, but I’m just here alone trying to take this story from zero to the next level. It’s a lot of pressure.
So, I feel like I learned so much in taking this whole journey by myself. Looking back, there are some points I could have taken a different path or been a little more efficient and not gotten lost. Even though it was challenging, the experience was really meaningful from a creative process perspective of taking something from zero to finish all by myself and seeing all the twists and turns that I had to go down.
How do you think data visualizations are becoming more important in storytelling?
I think we’ve seen that, yeah, it’s a new thing, but also most big newsrooms have invested in having graphics, interactives and data visualizations. I think it’s really clear that this technology can help visualize information in ways words can’t, help explain complicated topics, draw people in to be invested in the story and see themselves in it and make complicated points in simple ways.
We’re seeing places like The New York Times really prominently feature charts, graphs and maps to explain topics that would lend themselves to that. I’m sure there are places that are more behind the curb on this. but I would say people recognize the value of it and it has had a big effect.

- How The Pudding visualized the evolution of “wonky” grooves - December 20, 2023


