How the Washington Post logs fatal police shootings in the U.S.
The Washington Post first began examining fatal police shootings in the United States in 2015. The newspaper’s investigation that uncovered that the FBI was undercounting half the number of fatal police shootings in the country.
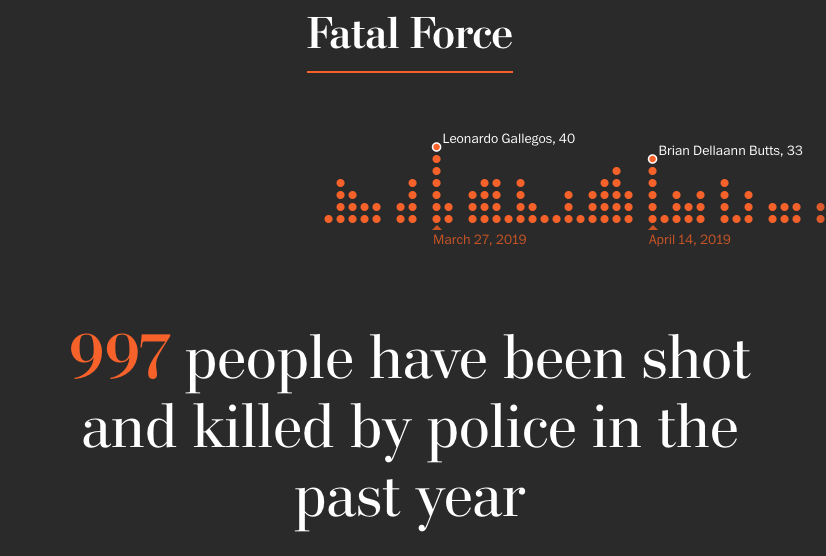
The Washington Post created a page with a database, charts, graphs, and maps to inform and illustrate the scope of cases where an on-duty police officer shoots a civilian and that results in a fatality. The name of the project is “Fatal Force.” The project’s landing page shows a rolling count of the number of people who have been shot and killed by a police officer in the country in the last year as well an animated chart showing the names of the victims in the background.
The Post’s data is based on social media posts, police reports, and news accounts. Moreover, there is a link on the page where viewers can submit tips about police shootings and killings.
Ted Mellnik, a database editor for the Post, worked closely with a team tasked with creating and improving Fatal Force, where he collected information and made it available for reporters to explore and analyze. Mellnik spoke with Storybench about how the project played out, how decisions were made, and how the database became available to journalists and viewers invested in the issue.
Tell us about your interest in data reporting.
I’m interested in how reporters collect data and how it is organized and how it can be used for reporting. It is an interesting challenge, the intersection between reporters and data, because you don’t want to just accumulate data, you want reporters to explore it.
The Post started tracking the killings in 2015. For how long have you been a part of this project?
I was very involved in the first two years and have not been that involved in the last two to three years. A lot of my involvement was organizing the data collection and setting the system of how the data was going to be collected. The second area I was involved in was coming up with ways to display the data in the graphics.
What decisions did you have to make when thinking about collecting, storing and publishing the data?
I did not make the decisions alone. It was a big discussion with a lot of people involved. We started the project by making a spreadsheet to begin collecting pieces of information, one row for shootings and then thinking of what to gather, then name, date, police department, location. And you know, a spreadsheet is easy to add columns. So, when we came pretty close to the design of what we wanted, the next part was to build an internal application for creating the data set. It functions as a tool for the reporters and editors to explore the data.
That is the interesting part, about how you give reporters and editors a page that shows major trends in the data to explore and filter. We kept making changes during the first year. From a nuts-and-bolts standpoint, for everything you collect it helps to have categories. Categories makes it a lot easier.
We got the basics down to age, race, gender, and whether the victim was armed or not. After that there were some sort of interesting things that came up later as they collected more information. Weapons – whether someone was armed became more complex than you might originally think. A person can have a weapon in their pocket. There are several combinations of circumstances. What if they are armed and running away? There was a story about people who were shot while they were fleeing.
How is this different from any other pieces you have worked on in the past?
One of the big differences is the scale and how important it was for the newspaper. There were dozens of people who worked on this, especially in the first two or three years. So, it is not often that I get to be involved in something that has so many people putting work into it.
The data gathering was unique because it took a lot of work to do the research, it took a lot of work to develop the data and develop the tools to explore and publish the data, and that does not happen very often either. We all know that it is important for reporters or for news organizations to be willing and ready to create their own data. But unfortunately, that probably doesn’t happen as often as it should, and it was a real privilege to be involved in a project that involved creating unique and important and useful data on a large scale.
What was the process that you had to go through with your team to make it such an innovative piece?
A lot of the people who are in the graphics department … it’s a hybrid. They are artists and designers, but they are also web programmers. We are really lucky here because if you can come up with an idea for something that you think might be a good way to communicate it, there is somebody here who can execute that idea. It is really lucky to have a lot of real talented people to work with. But the overall way the graphics were displayed was basically the work of those designers.
There were a lot of discussions about what the main points were. One of the things was to show how big the number is, when you go to the page that big number is at the top and there is not a lot of information to distract from that. So that was kind of the starting point. And then at the opposite end of that, we wanted to respect all of these people as people and have them all represented as a person on the page. So those were kind of the two big things. So, they are kind of opposite from each other. One to show how often this happens and then the last thing to offer some glimpse at these human beings who have died. And then we had various things in the middle about where they were and what their ages were; some of the factual trends. The factual trends may have been sort of the easy part – race, gender, age – and that sort of thing are kind of obvious simply facts.
What is the status of the project regarding the number of tips sent to the email provided on the page?
Something valuable is that it enables us to edit the data to make it more accurate. People who are familiar with events, or family members, or even law enforcement people keep us up to date on things that may be new about instances we already have. And then there have been people and there are still people who send in tips about shootings that have happened. Unfortunately, there are parts of the U.S. where police shootings aren’t necessarily big news or there may not be a local news organization, so we do get a lot of feedback.
- How the Washington Post logs fatal police shootings in the U.S. - March 13, 2020


