How The Washington Post uncovered the sources that make AI chatbots sound so smart
How did AI chatbots get so smart? We set out to show our readers at The Washington Post in “Inside the secret list of websites that make AI bots like ChatGPT sound so smart.” Our journey started with an attempt to understand the underlying websites that shape chatbot knowledge.
Accessing the data
To start, we pursued access to Google’s Colossal Cleaned Crawled Corpus, or C4 dataset that encapsulates the vast web sources training artificial intelligence models. C4 is a dataset created by applying a set of filters to a single snapshot of Common Crawl.
Although Google does not offer it for download, researchers at Allen Institute for AI re-created C4 and provided us with a list of the top 1,000 domains from C4. Initially, we aimed to categorize these domains manually. However, we quickly learned that they only accounted for a mere 8% of tokens — key words – far from a representative sample.
This revelation prompted a deeper investigation.
The Allen Institute researchers extracted all 15.7 million domains and shared them with us. Navigating such a vast dataset, however, presented its own set of challenges.
Cleaning and analyzing
Many websites have separate domains for their mobile versions (i.e., “en.m.wikipedia.org” and “en.wikipedia.org.”) We decided to treat these as the same domain. We also combined subdomains aimed at specific languages, so “en.wikipedia.org” became “wikipedia.org.”
We engaged with other researchers and utilized categorization data from the analytics firm, Similarweb. R Markdown became our tool of choice for data cleaning and analysis, enabling us to produce interactive web pages for collaborative access.
Similarweb helped us place two-thirds of them — about 10 million domains — into categories and subcategories. (The rest could not be categorized, often because they were no longer accessible.) This necessitated a hands-on approach, as we combed through the datasets to enhance and reorganize the categories.
Our comprehensive examination of these 15 million websites unveiled a diverse range of sources. From proprietary and personal to those bearing controversial content, these domains collectively shape the responses of chatbots.
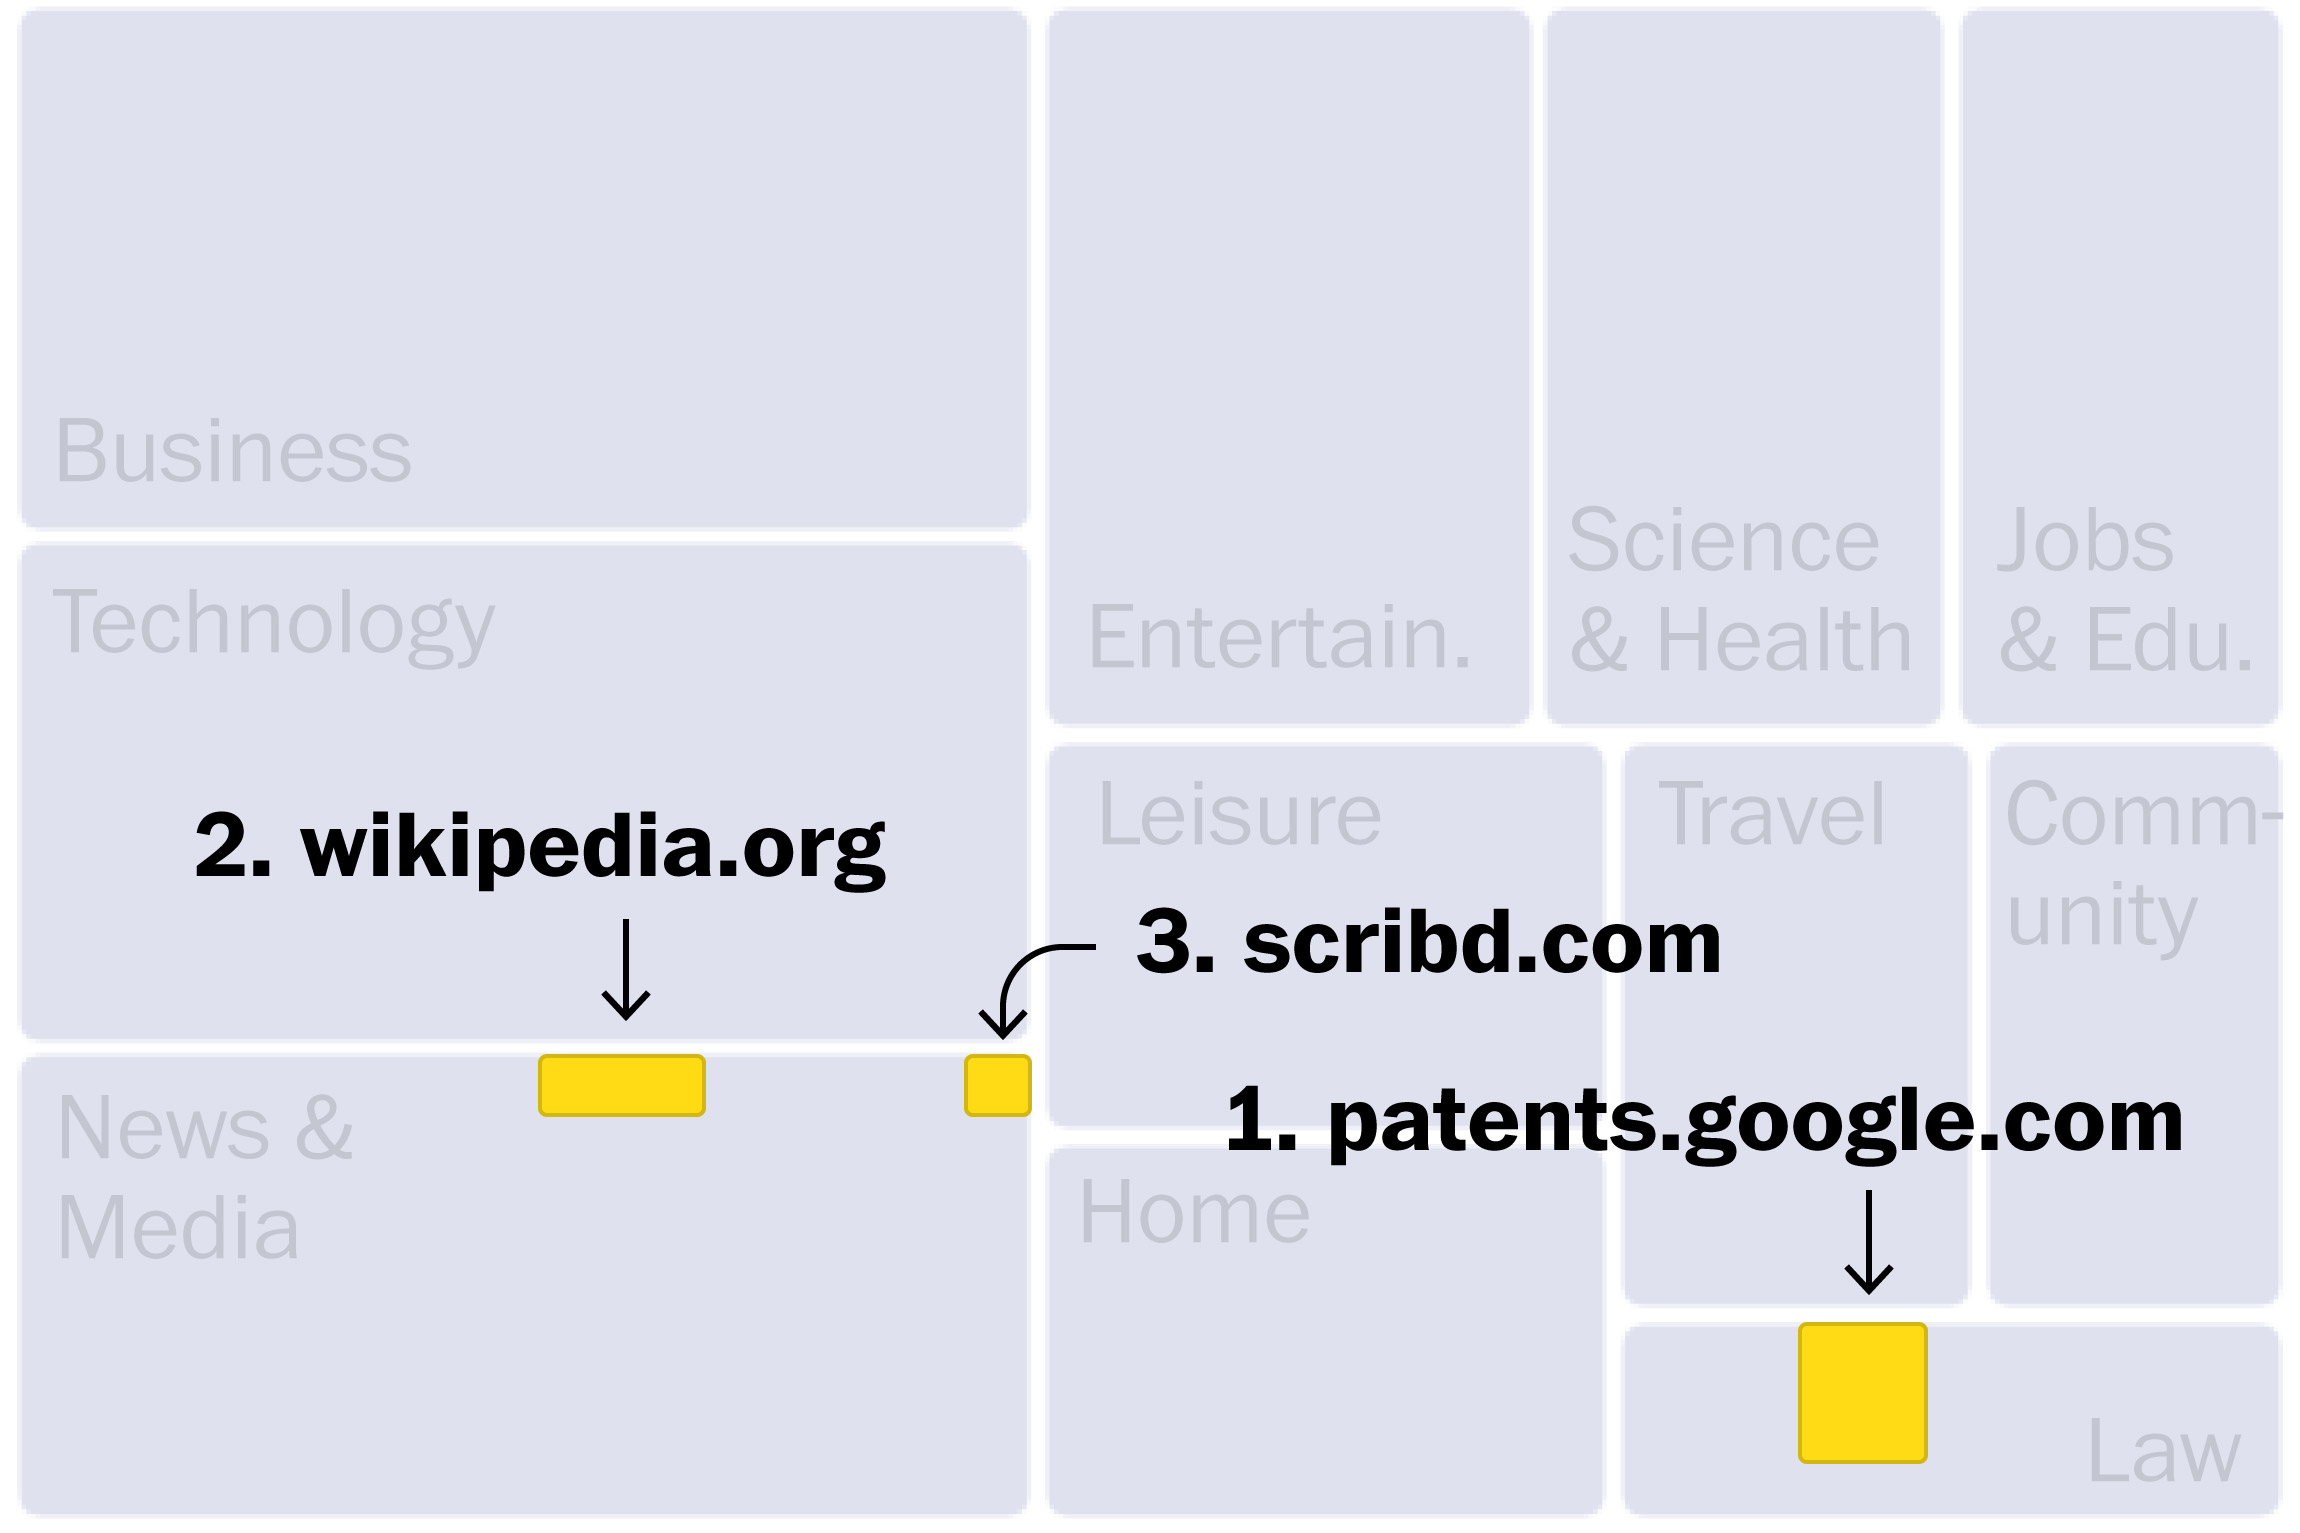
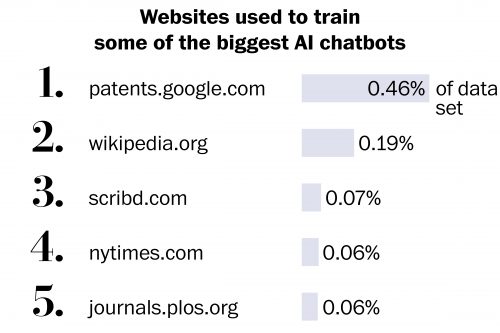
To determine the significance of each website, we employed the token count, reflecting the volume of words or phrases from each domain. A snapshot of the top websites by tokens:
Visualization
Given the hierarchical and part-to-whole nature of our data, we decided to visualize the information with a tree map.
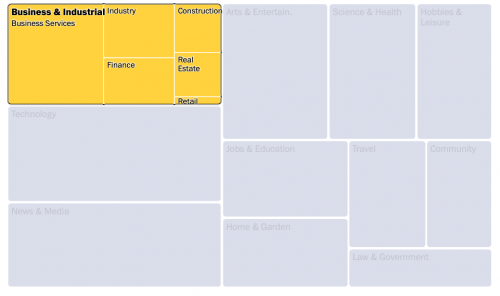
However, this visualization relied heavily on detailed annotations, highlighting the importance of revealing individual websites within overarching categories. We spent a lot of time getting annotations right— tricky for a dynamic chart that rearranges itself.
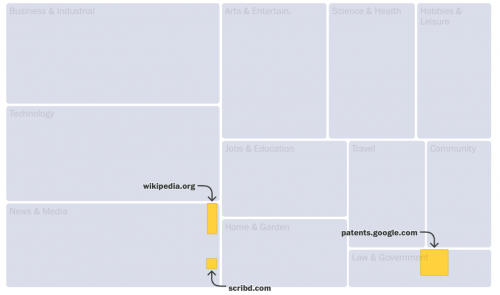
There are two primary methods to avoid label collisions within a given parent container:
- Nudging colliding labels: We have a
labelAvoiderNudgefunction that detects colliding labels and then nudges to avoid overlaps. I simplified these functions to just use the nudge to the right method and limit the attempts to a hard-coded number rather than providing it as an option.
const getCollisions = (tree: RBush<Body>) => {
return tree.all().filter(body => tree.search(body).length > 1);
}

export const simpleLabelAvoiderNudge = (labels: Body[]) => {
const tree: RBush<Body> = new RBush();

// Insert all label bodies into the R-tree.
labels.forEach(label => tree.insert(label));

// Check and handle collisions.
let attempts = 0;
while (attempts < 3) {
const collidingLabels = getCollisions(tree);
if (!collidingLabels.length) break;

collidingLabels.forEach(body => {
// For simplicity, just move the label slightly to the right.
body.minX += 5;
body.maxX += 5;

tree.update(body);
});
attempts++;
}

// This returns the updated labels.
return labels;
}- Positioning choices for labels: We have another function called
labelAvoiderChoicesthat changes the position of colliding labels based on a set of provided choices: top right, top left, bottom right, bottom left, etc. For the sake of brevity, I’ll assume that we have two position choices — the current position and a new position slightly below — and that the new position is hard-coded to be a certain number of units below the original.
export const simpleLabelAvoiderChoices = (labels: Body[]) => {
const tree: RBush<Body> = new RBush();

// Insert all label bodies into the R-tree.
labels.forEach(label => tree.insert(label));

// Check and handle collisions.
let attempts = 0;
while (attempts < 3) {
const collidingLabels = getCollisions(tree);
if (!collidingLabels.length) break;

collidingLabels.forEach(body => {
// Move the label slightly below as our second position choice.
body.minY += 10;
body.maxY += 10;

tree.update(body);
});
attempts++;
}

// Returns the updated labels.
return labels;
}
Both of these functions utilize spatial indexing through the RBush library, a tool to manage and query rectangular spatial data, making collision detection efficient.
To gain further insights, the Allen Institute granted us access to their full-text search API. Our searches revealed telling statistics, like 72,000 mentions of the term “swastika” and a whopping 200 million hits for the copyright symbol “©.”
Our exploration wasn’t without its challenges. Delving into the “clean” dataset, we encountered a disturbing amount of offensive material. We spent days combing through offensive domain names, including racial slurs, obscenities and porn, to confirm their existence and mask specific words from readers in our searchable database.
An interactive searchable tool
When we discovered our personal websites within the dataset, we realized we would need a public search function.
This posed a challenge: how could we enable a search through 15 million domains without constructing an API?
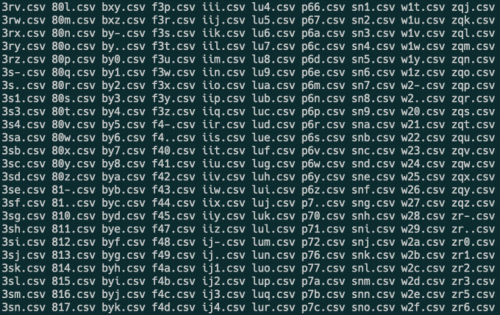
Our solution entailed grouping domains by their initial three letters, creating a CSV for each combination. Now, when a user types three characters, the pertinent CSV loads, filtering the results. It’s worth noting that 10 million domains are scattered across 46,000 files, exemplified by names like “ksc.csv.”
Concluding thoughts
Like all stories, this piece relies on regular reporting. It’s more than accumulating data points — it’s about critically examining them, identifying the gaps and seeking further insights.
When we realized the initial 1,000 domains were insufficient, the solution wasn’t just a matter of getting more data. We actively communicated with the researchers to obtain the full dataset for all domains to get the complete picture of what gets fed into the models.
Leveraging the categorization data from Similarweb helped streamline the process, but it wasn’t just a simple import and process task. There was a substantial manual inspection phase — checking the data, discussing the nuances and discrepancies and repeatedly consulting with researchers. This iterative process is a reminder that regular reporting isn’t always linear. It’s a back-and-forth process, demanding patience and a detail-oriented approach.
Kevin Schaul is a senior graphics reporter at the Washington Post. He graduated from the University of Minnesota with a degree in computer science, though all his professional work has been in newsrooms.


