How to turn data into an interactive story with Twine
Twine bills itself as “an open-source tool for telling interactive, nonlinear stories.” That means you can incorporate graphs, charts and even videos and photos into a story. Here’s a quick tutorial on how to use it.
General steps
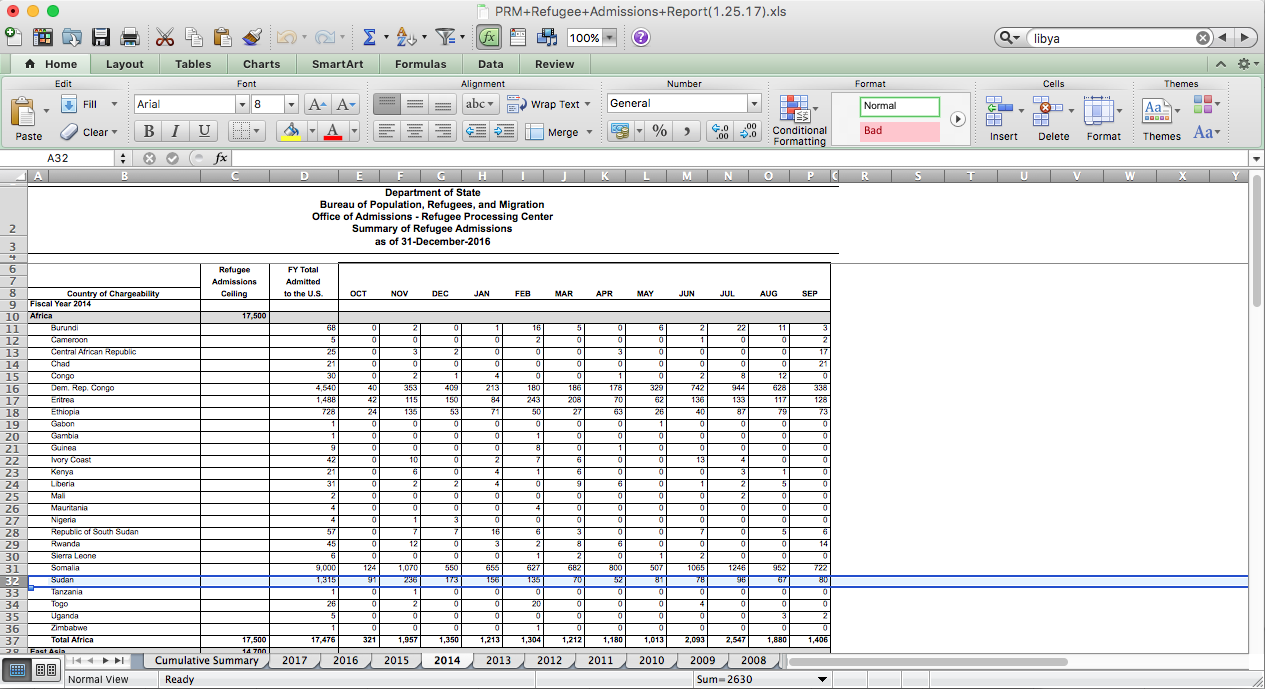
Step 1) Choose your data topic area. (You probably already knew that, right?) This will inform how you use Twine. We chose to focus on refugees entering into the United States.
Step 2) Twine is essentially an interactive storytelling engine. In other words, you don’t need to know code to build a game, quiz, or an avatar-based story. As we continued to narrow down our focus area, based on the information available to us and the story we wanted to tell, we concluded that a quiz would best present our findings. We also liked that with a quiz we would be able to put data throughout the interactive instead of just at the end, or represented in a secondary sense through the outcomes of the answers given.
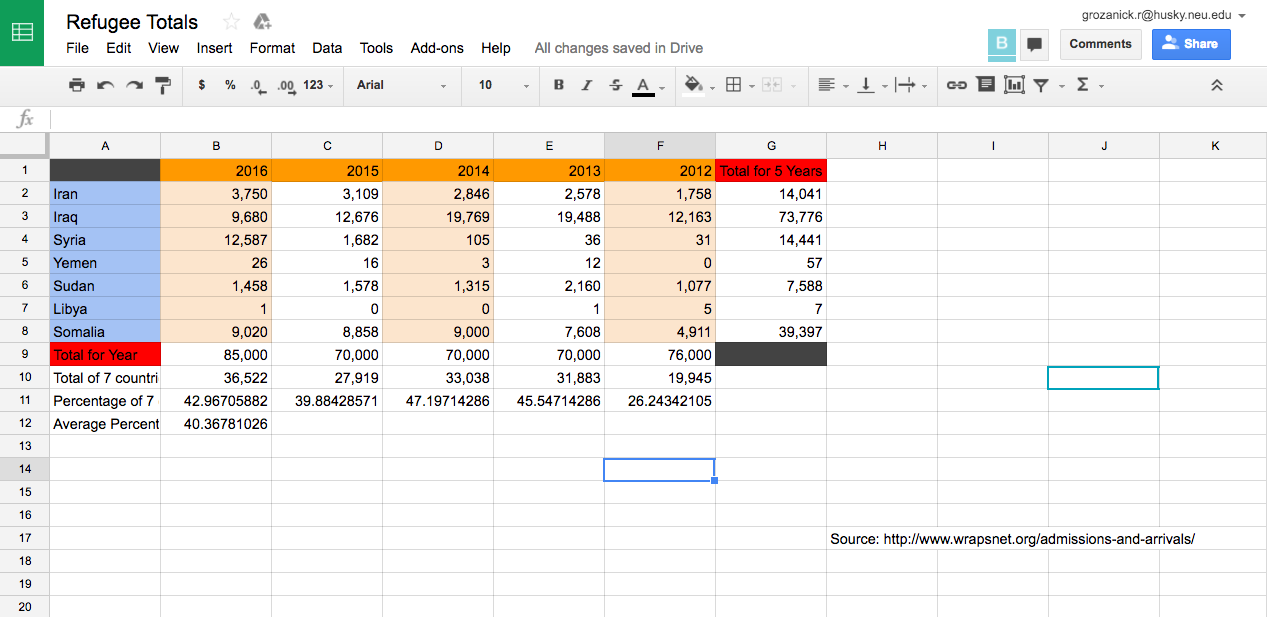
Step 3) Choosing what questions to ask for in the quiz was the data analysis part. Basically, each question and the correct answer could be an entire story unto itself. The idea was to create a quiz that combined popular topics regarding refugees. Depending on the quiz taker, the quiz will either reaffirm or challenge their general understanding and view of these topics using data — or at least that’s the goal.
Step 4) Once we crafted the questions and analyzed data to provide the answers, we needed to put this into a Twine framework.
Step 5) Twine is a great way to tell interactive stories through text and images. For the sake of this guide, we will focus on the basic text functions of Twine.
More Specific Steps for Visualizing Data with Twine
Go to Twinery.org. From there you can choose to either download Twine for Windows/Mac or run it through your browser by selecting the “Use it online” option.
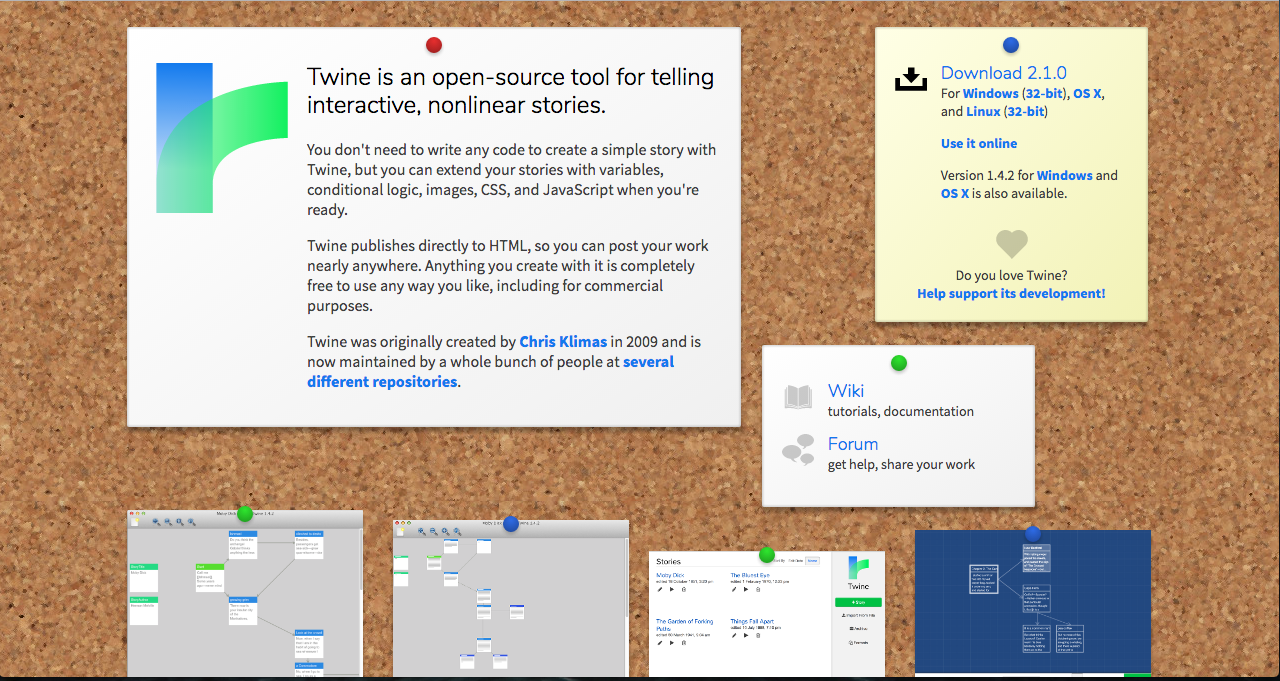
That second option is great for getting started in Twine, so we’ll be using that for this guide. Just remember: if you use Twine online it will save your stories in the browser, so make sure to always use the same browser if you want to continue working on the your stories.
Once you hit “Use it online”, some on-boarding steps will pop-up. After you’ve waved them away, you will be directed to a screen that looks like this:
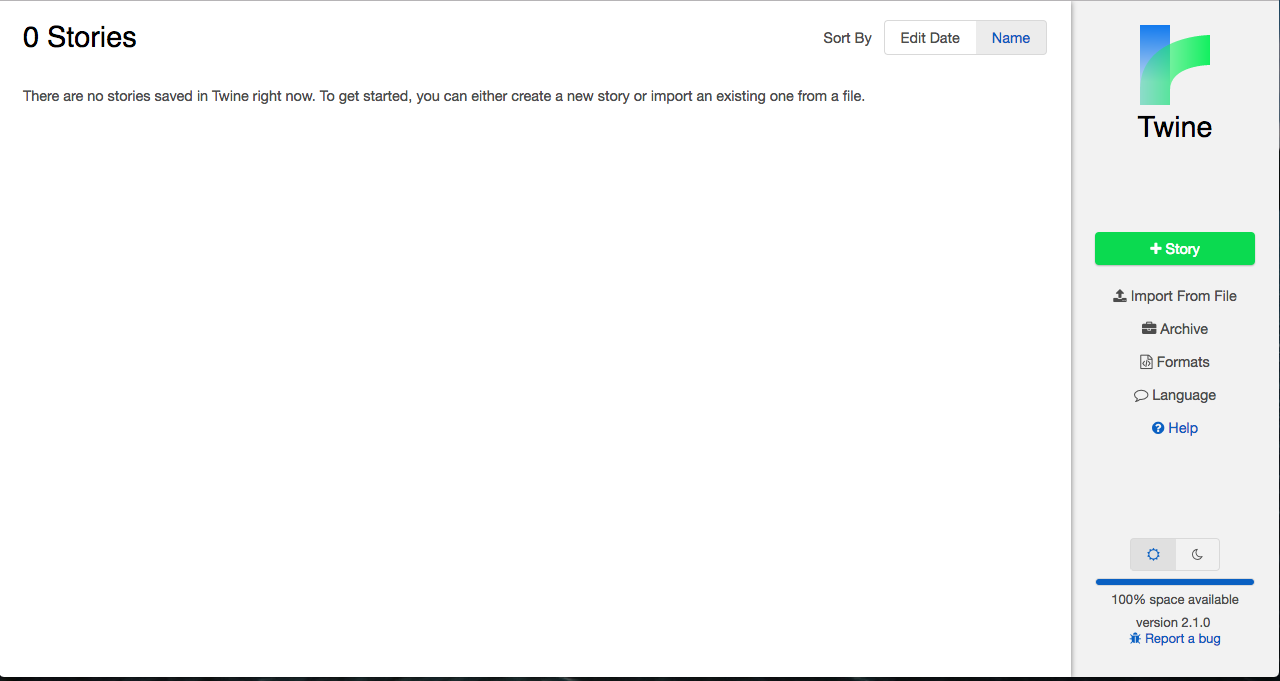
2) From this screen you can manage all your stories, which will
appear on the left side of the screen. But you’re just getting started, so click the giant green “+Story” button on the right to create a new story.
You’ll be prompted to name your story. Keep in mind you can always change this later. Click “+Add” when you’re ready to start working on your story.
You should now see a gridded workshop screen with a post-it note-looking thing in the center.
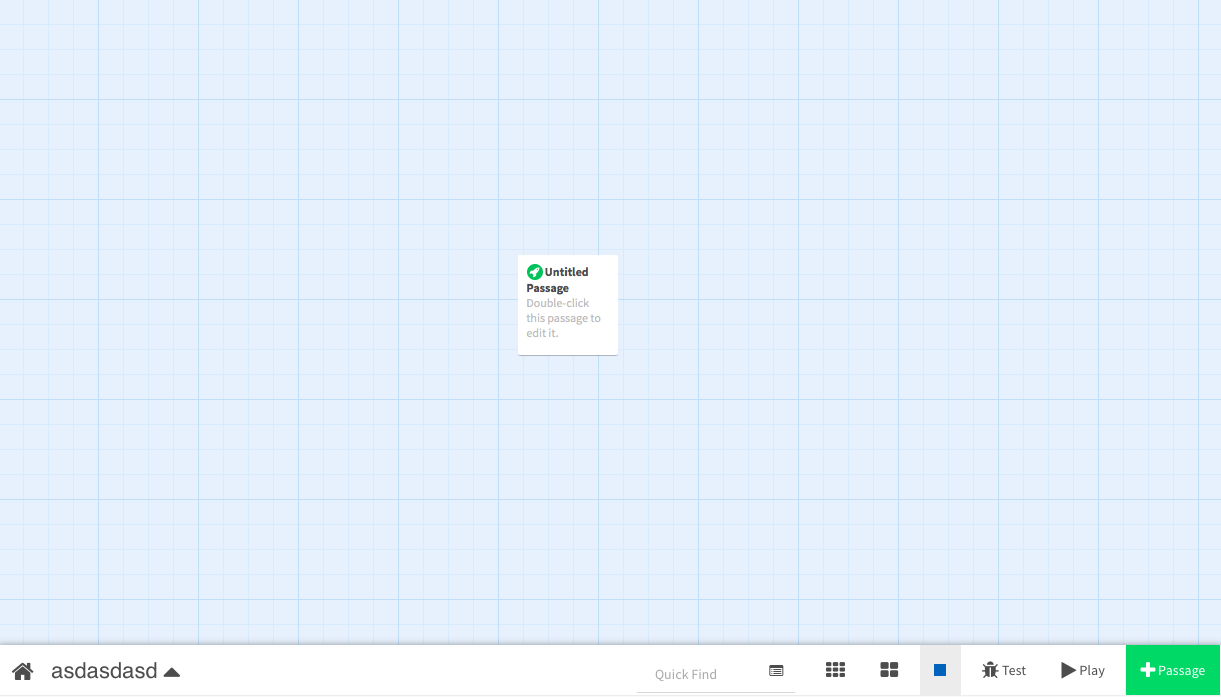
This is your story! It’s not much to look at now, but before long it’ll look a lot more impressive.
3) The post-it note-looking thing is called a passage and each passage is a building block in your story. These contain the text and/or images that users will interact with to go through your story. This first one has a little rocket ship symbol in the top left corner. That means it’s the start of your story. You can add new passages by clicking the big green “+Passage” button in the bottom right corner of the screen.
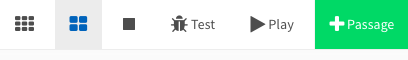
From that tab you can also zoom in and out with the three gridded square buttons, test a particular passage to make sure it works or play through your whole story.
You can rename the first passage if you’d like, but for now we’re going to leave it unnamed.
4) Creating passages to make a data quiz in Twine
Twine works by creating branching paths that lead to different or similar end points. Basically that means that users get to choose their own path through the story.
To start off our quiz, we kept in very simple. After the user enters the quiz, they have one option: click “Begin.” In order to put that option in, you have to create a new passage that links to your starting passage.
You can do that either by clicking the “+Passage” button or by double-clicking on your starting passage to open up the passage editing screen.
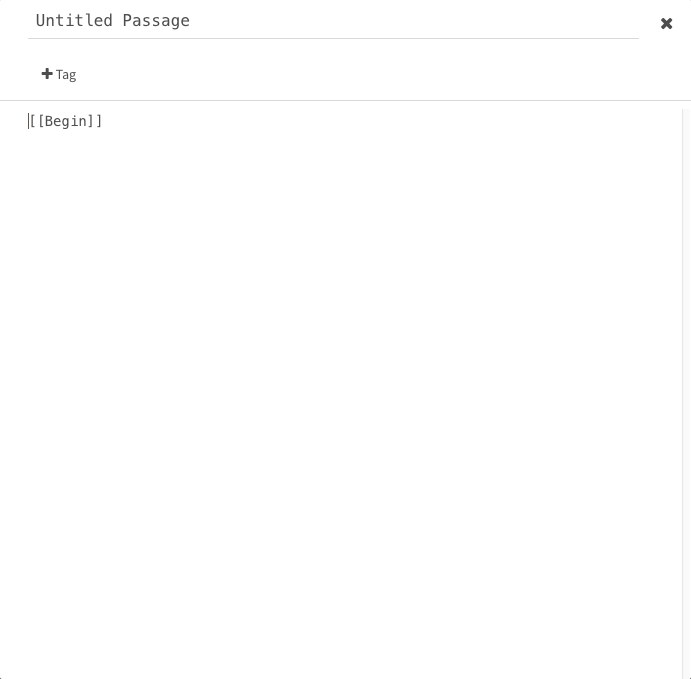
At the top is the title of the passage and below that is where we can tag other passages (you don’t need to understand that for this guide).The large blank space in the bottom of this screen is where you can put in text. Here you can add the text for your story and link passages together. In this case you don’t need to add any text; 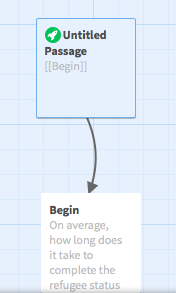 you just need to add the option to begin, which means linking the starting passage and this new “Begin” passage. In order to create a link to another passage, type the name of the passage inside double square brackets: in this case [[Begin]].
When you exit the passage editing screen you should now see a directional arrow that links your two passages.
5) Now that you have the option to start the quiz, it’s time to enter the questions themselves. Go into the passage editing screen for the “Begin” passage. Here you’ll enter the text for the first question and all the possible answers as linked passages.
This is what our first question looked like:

The question is at the top, and all the answers appear below in the order we wanted the user to see them. It’s essentially writing a multiple-choice quiz.
You may have noticed that there’s some new blue text in the linked passage options. The answers are there but there’s some extra stuff after them. This text helps create a more efficient flow in your story. Stories in Twine can get overwhelming very quickly, so it’s important to consolidate passages when you can.
In this case, we made it so that clicking on an answer would direct the user to either a “right” or “wrong” passage without them knowing. This is essential for making a quiz. Adding “->Passage name” will let you hide where you are sending the user. All they will see is “3-6 months” or “18-24 months,” but each of those answers is tied to a new passage, which they can’t see the name of.
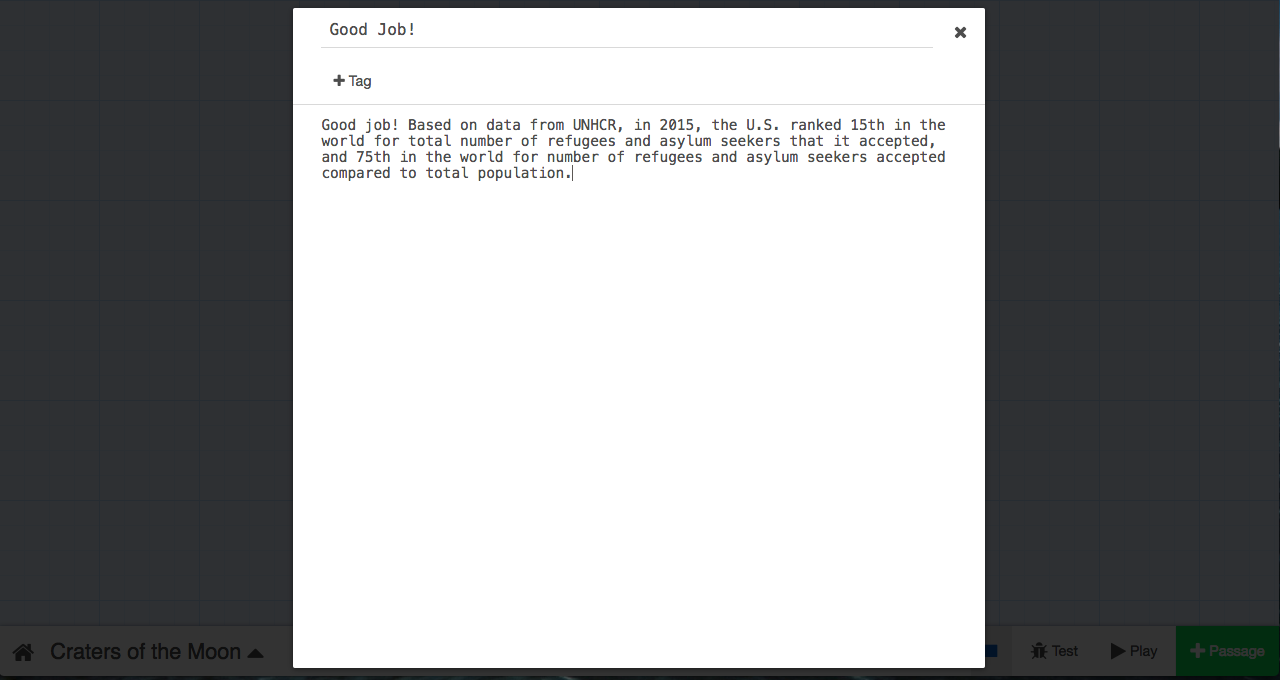
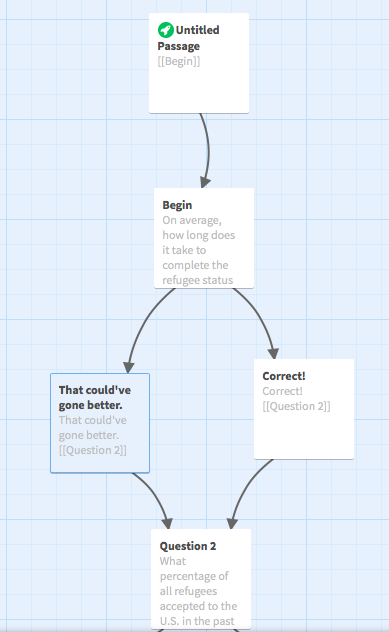
In the example above, three answers lead to “That could’ve gone better” and one answer leads to “Correct!” Both of those passages should then include the text in their title to let the user know if they got the question right or wrong. They can also include data, text or visualizations that provide more context for that answer. Here’s an example from our quiz:
After that text, make sure to include a link to the next question (something like [[Question 2]]), so that users can move on when they’re ready. Your story should look something like this at this point:
Twine can become very complicated for the designer or storyteller, but we kept it simple for our quiz (and this demo). Each question was multiple choice, which meant the user can only go down two paths based on their answer: right or wrong.
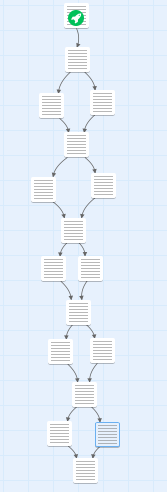 You can just continue the pattern of questions, answers and linked passages until you feel your quiz is done. Remember: if you’re story gets too large you can always zoom out with the bottom right tab or drag passages around to save space. By the end of our five question quiz, we had a pretty sizable story already.
There’s so much more you can do with Twine than just text-based storytelling. With a little bit of coding you can add images, video and hyperlinks to make your story way more dynamic than our simple quiz.
You can have wrong choices that could send players back to the beginning of a story, or right ones that propel them forward, chutes and ladder style. You could have the amount of outcomes for a given story be determined by the statistical likelihood of the outcome given the user’s choices. Basically, Twine let’s you focus on the creative part of telling an interactive story and forget (by and large) about the coding part.
To play the quiz we made, click HERE.
- How to turn data into an interactive story with Twine - March 17, 2017


