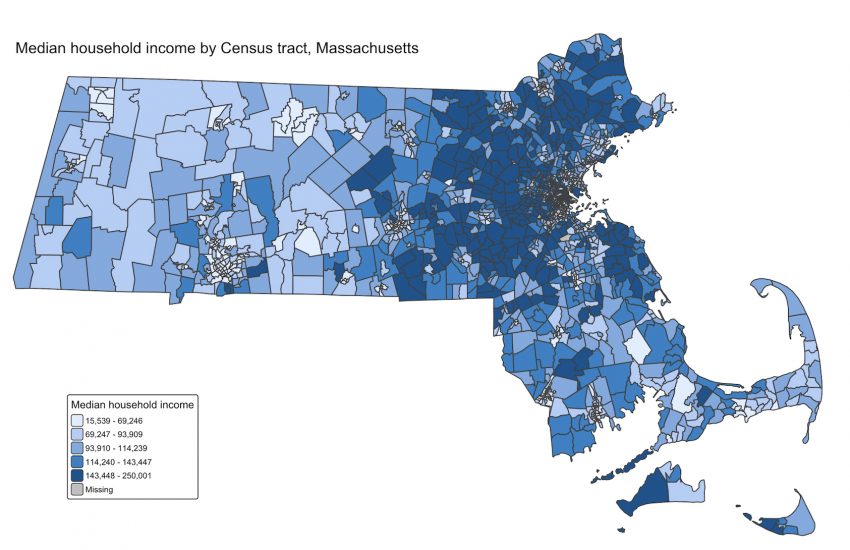
Learn How to Create Maps That Connect the Dots with GeoJSON
There’s a bit of coding magic behind every map-based visualization in the form of a GeoJSON file. That’s the code that literally lets you connect the dots to the data. While visualization programs like DataWrapper and Flourish offer maps with built-in GeoJSON files for commonly-used locations and boundaries, there are lots of times when you’ll want to create a place-based visualization for which there is no built in solution. These can also be loaded into programs like Leaflet, Mapbox and GoogleMaps. Later on in this post, we’ll look at how to search for existing GeoJSON files and how to draw your own, but first a little bit on the basics on how to create points, lines, areas and add descriptive information for them.
The basic structure of GeoJSON
The “Geo” part of the name refers to “geography” and it’s combined with JSON (JavaScript Object Notation). You may recognize the notation below, but it’s not necessary to know JavaScript to use GeoJSON. Every GeoJSON object has a “type” property that specifies what kind of geographic data it represents and “coordinates” that use latitude/longtitude (lat/long) information to say where it goes. The main types are:
Creating points
A point describes a single location, a dot on a map. To drop a point into the center of Boston Common, we use the following code. We start out by defining our lat long coordinates and giving it a type of “Point.” Copy and paste what’s below into any code editor (or any text editor, for that matter):
{
    "coordinates": [-71.06566375556966,42.355070741285914],
    "type": "Point"
}
That’s all we really need to place a point on a map, but let’s add a little more information — the name of the location. Most real-world GeoJSON uses Feature objects that combine geometry with descriptive properties. We do this by defining a “Feature” with properties (the name) and a geometry (the lat long). Our code now looks like this:
{
"type": "Feature",
"properties": {
"name": "Boston Common"
},
"geometry": {
"coordinates": [-71.06566375556966, 42.355070741285914],
"type": "Point"
}
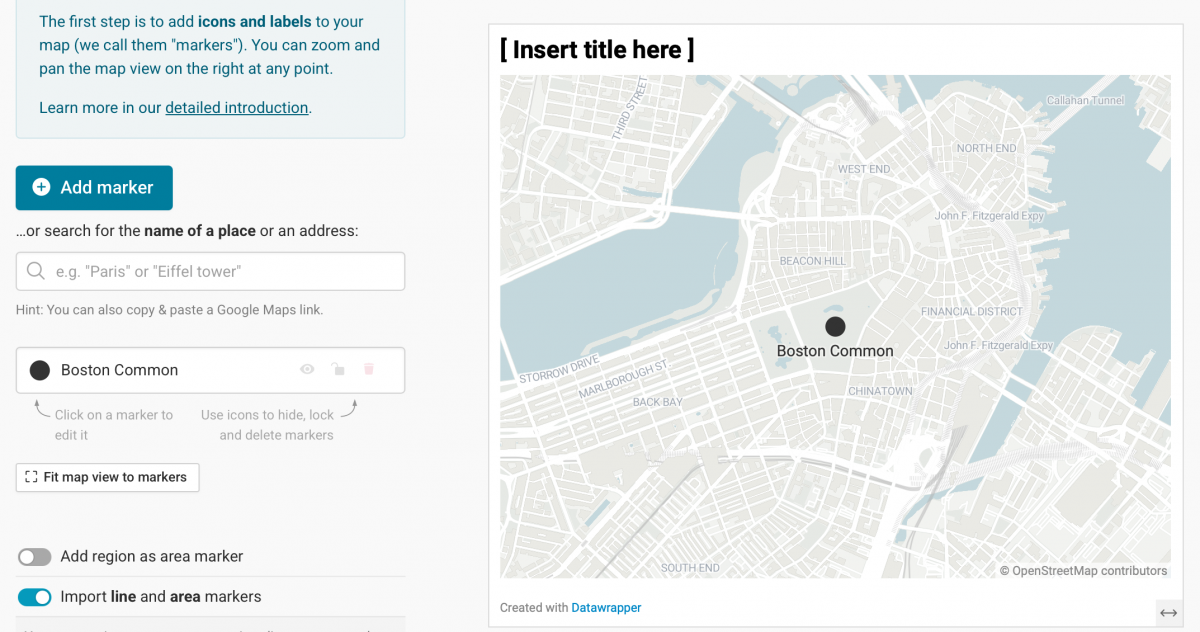
}Save the doc naming it bostoncommon.geojson (any name will work, but the “.geojson” at the end is critical because it identifies what type of file this is).
Open up DataWrapper, Flourish or any map-making app. Create a new map, and at the first step (“Add Marker” in DataWrapper or “Template chooser” in Flourish), either click the toggle switch to “Import markers from file” (DataWrapper) or click the “Blank” option (Flourish) and upload the geojson file you just created. I’ve zoomed in a bit so we can see what we’ve created.
Creating a line or path
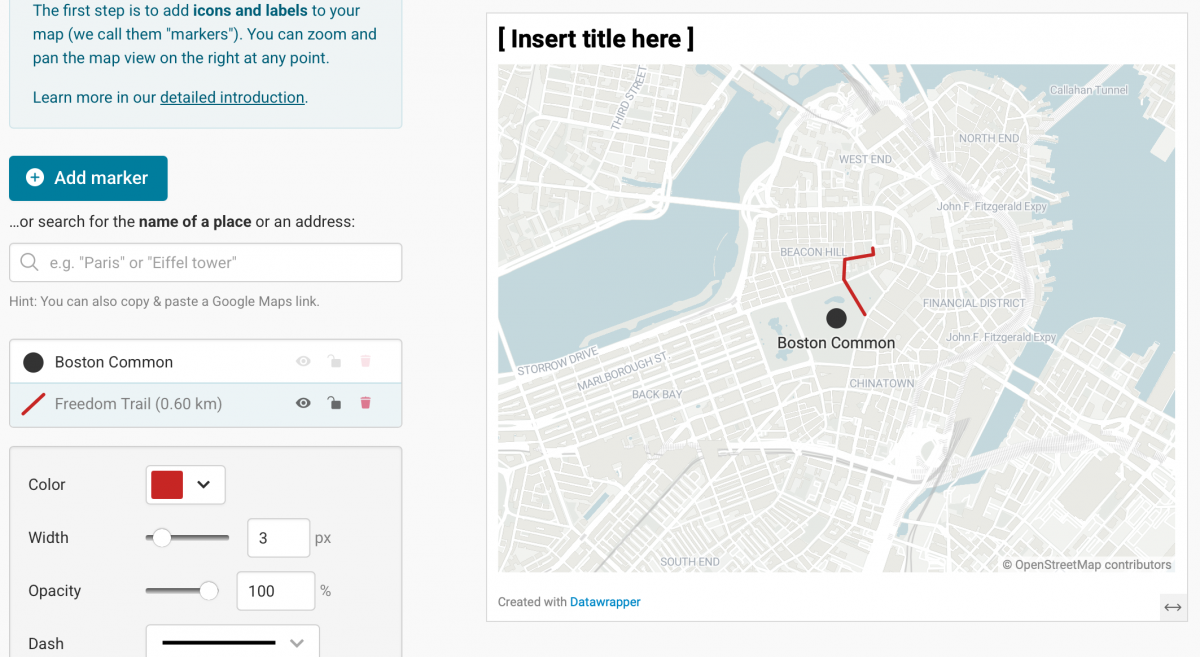
To create a line between points, use type LineString. Here, we link multiple coordinate points to show part of the Freedom Trail through downtown Boston.
{
    "type":"Feature",
    "properties":{
        "name": "Freedom Trail"
    },
    "geometry":{
    "coordinates":[
        [-71.06350649853047,42.35528171937716],
        [-71.06510509510315,42.35725586252178],
        [-71.06502999325103,42.358381651326596],
        [-71.06285203953101,42.35865120339966],
        [-71.06290568371087,42.35901588965811]
        ],
        "type":"LineString"}
    }
Save this new file as freedomtrail.geojson and import into your map-making app using the same method as before. Clicking on the marker file allows you to modify the color and width of the path you’ve imported. You should see something like this:
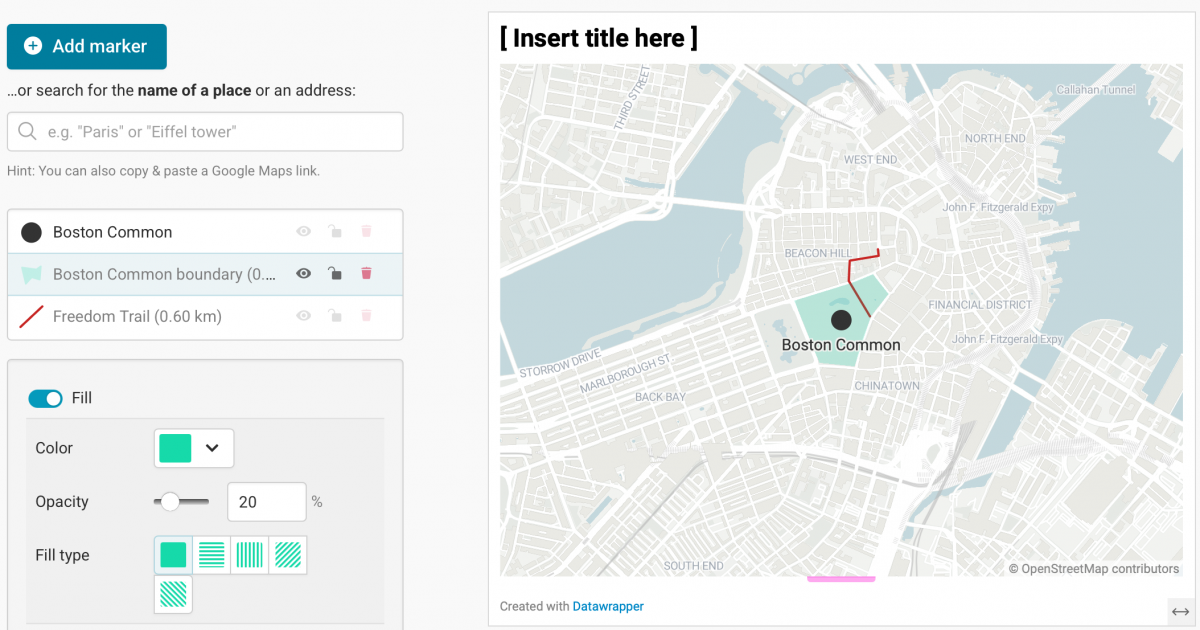
Defining an area with type: Polygon
Now let’s draw the boundaries of the Common using type “Polygon.” Note that polygons must close (first and last coordinates are the same).
{
      "type": "Feature",
      "properties": {
          "name": "Boston Common boundary"

      },
      "geometry": {
        "coordinates": [
          [
            [-71.06210184555079,42.356525857982916],
            [-71.06328201751708,42.357627875527356],
            [-71.06505227546688,42.357104617807806],
            [-71.06921506385832,42.35615322897371],
            [-71.06731605987586,42.352696394972924],
            [-71.06466603736887,42.35249817625038],
            [-71.06342149238586,42.35531282352238],
            [-71.06210184555079,42.356525857982916]
          ]
        ],
        "type": "Polygon"
      }
    }
Save this new file as bostoncommonboundary.geojson and import into your map-making app using the same method as before. Clicking on the marker file allows you to modify the color and and opacity that fills the polygon that you’ve created. You should see something like this:
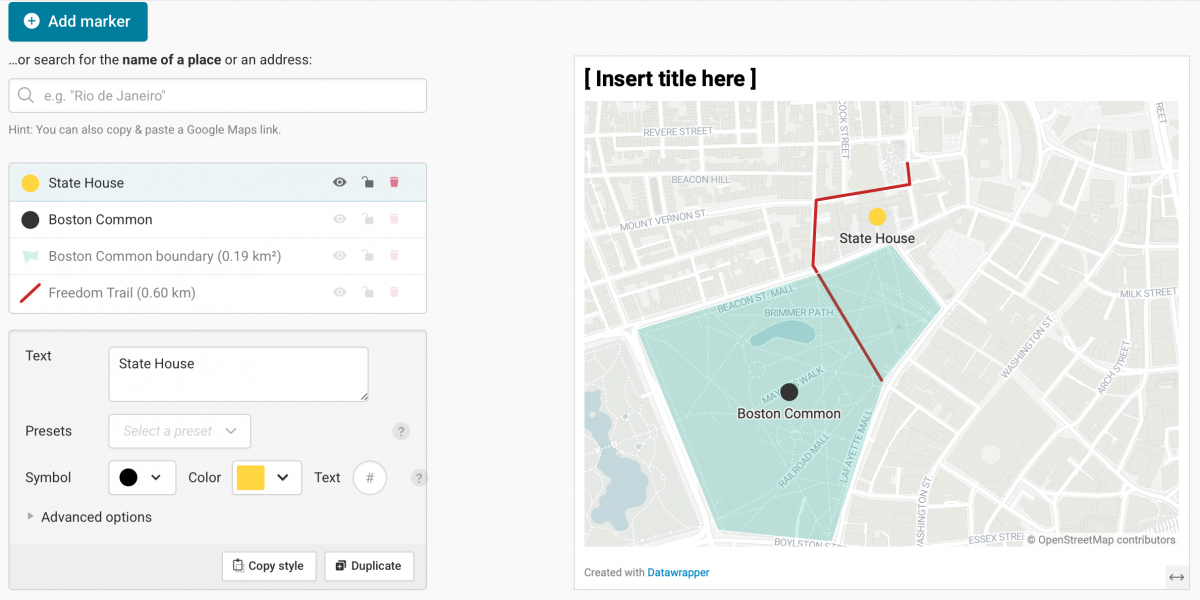
Adding feature properties in GeoJSON
We’ve been using the properties to add a name, but there are many additional properties that you can use. In this case we’re adding address and the year built to our point, which is the State House. Note that we can also specify display properties, in this case setting the marker color to gold. Save this file as statehouse.geojson and import it:
{
  "type": "Feature",
  "geometry": {
    "coordinates": [-71.0636, 42.3581],
    "type": "Point"
  },
  "properties": {
    "name": "State House",
    "address": "24 Beacon Street",
    "built":"1795-1798",
    "marker-color":"gold"
  }
}
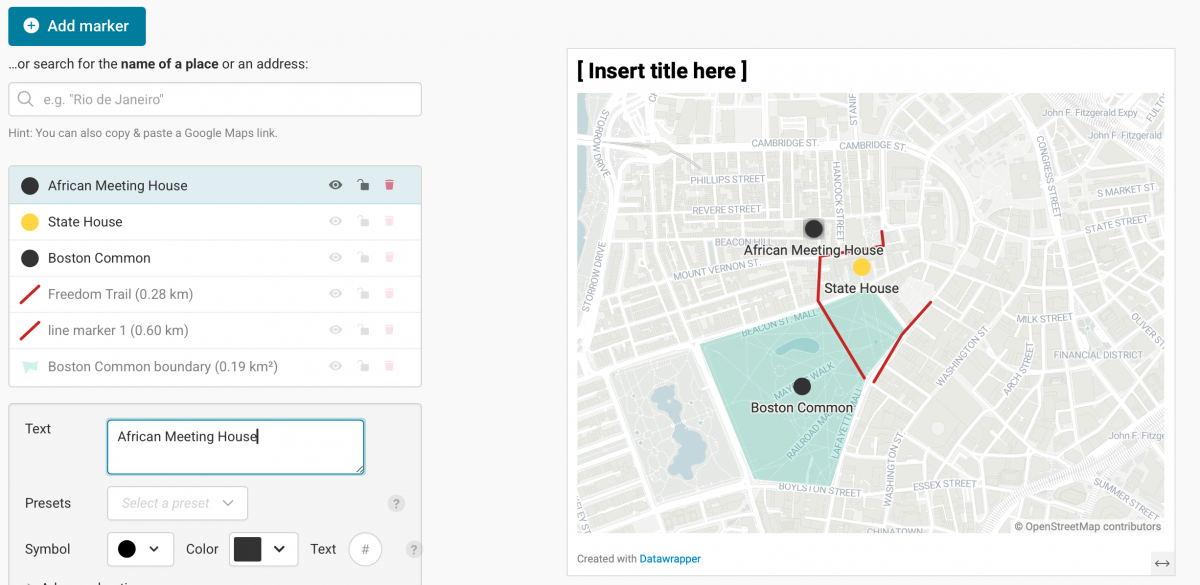
Creating multiple features and different types of features
FeatureCollection allows you to group multiple features together. While we’ve just stuck to one type of feature (line, point or polygon) so far, a FeatureCollection allows you to include multiple types in one file. In this example, we’ve added both a line and a point. Save it as meetinghouse.geojson and import it:
{
  "type": "FeatureCollection",
  "features": [
    {
      "type": "Feature",
      "properties": {"name":"Freedom Trail"},
      "geometry": {
        "coordinates": [
          [-71.0631760787562,42.355186939800944],
          [-71.06221323626842,42.356394362459724],
          [-71.06122121673552,42.35721367176595]
        ],
        "type": "LineString"
      }
    },
    {
      "type": "Feature",
      "properties": {"name":"African Meeting House"},
      "geometry": {
        "coordinates": [-71.06524764901106,42.359089418446246],
        "type": "Point"
      }
    }
  ]
}
  ]
}
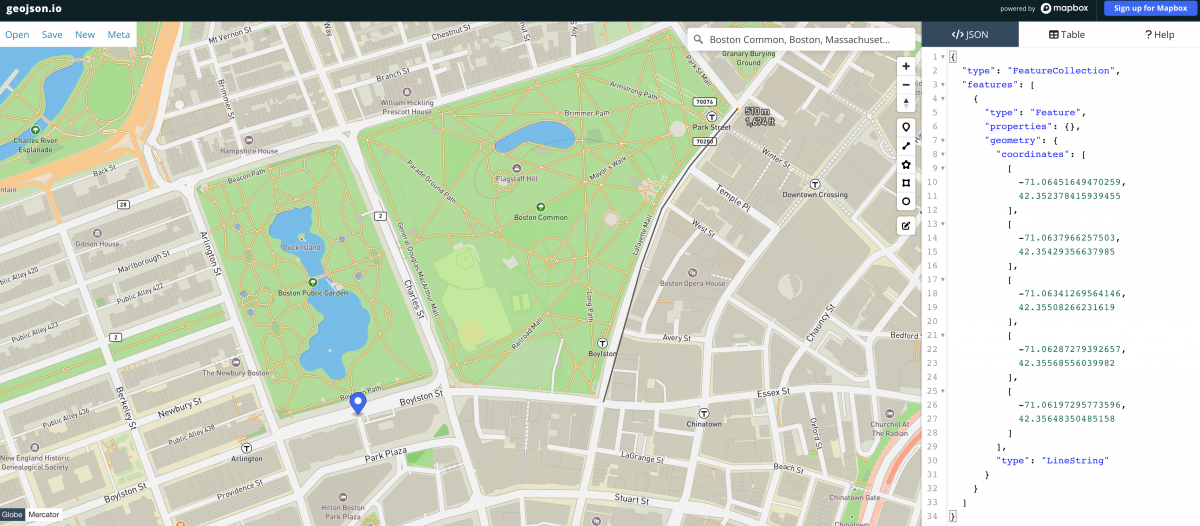
Using a visual editor to draw your own GeoJSON file
We’ve been manually typing in the GeoJSON code, but there’s an easy way to draw points, lines and polygons and turn it into code found at geojson.io. This site allows you to select a tool and draw points, lines, polygons, rectangular polygons and circular polygons simply by clicking on the map. As you do, code is created in the right-hand window and can be saved. It’s fast and easy, but only as accurate as you are!
Resources to find GeoJSON files
Finally, there are a lot of places to find GeoJSON data. The data.gov gov site features thousands of government-related sets and is a good place to start. Natural Earth provides shape files for an impressive array of geographic and political features. They’re not in GeoJSON format, but this site has them converted to GeoJSON.