
How to build a heatmap in Python
Heatmaps are effective visualization tools for representing different values of data over a specific geographical area. You could, for example, use them for temperatures, rainfall or electricity use. In this tutorial, I will provide a step-by-step guide on how to make a heatmap using Python and the Google Maps API.
First, you need to install three packages.
Numpy is a commonly-used package in Python. It can perform mathematical functions such as adding and multiplying, as well as creating N-dimensional array objects to store numbers. In this tutorial, we will be using it to create two-dimensional arrays to store values so they can then be plotted on the heatmap.
Pandas is a dataframe that makes reading CSV files very convenient. With this package installed, you can easily select specific rows or values inside a csv.
gmaps is the package we need to connect with Google Maps so we can create a heatmap with it.
Let’s import the packages first.
import numpy as np
import pandas as pd
import gmaps
import gmaps.datasets
Now let’s read our csv file with pandas. The data is from Analyze Boston, the City of Boston’s open data hub.
crime=pd.read_csv("Boston_crime_incidents.csv")
crime.head()
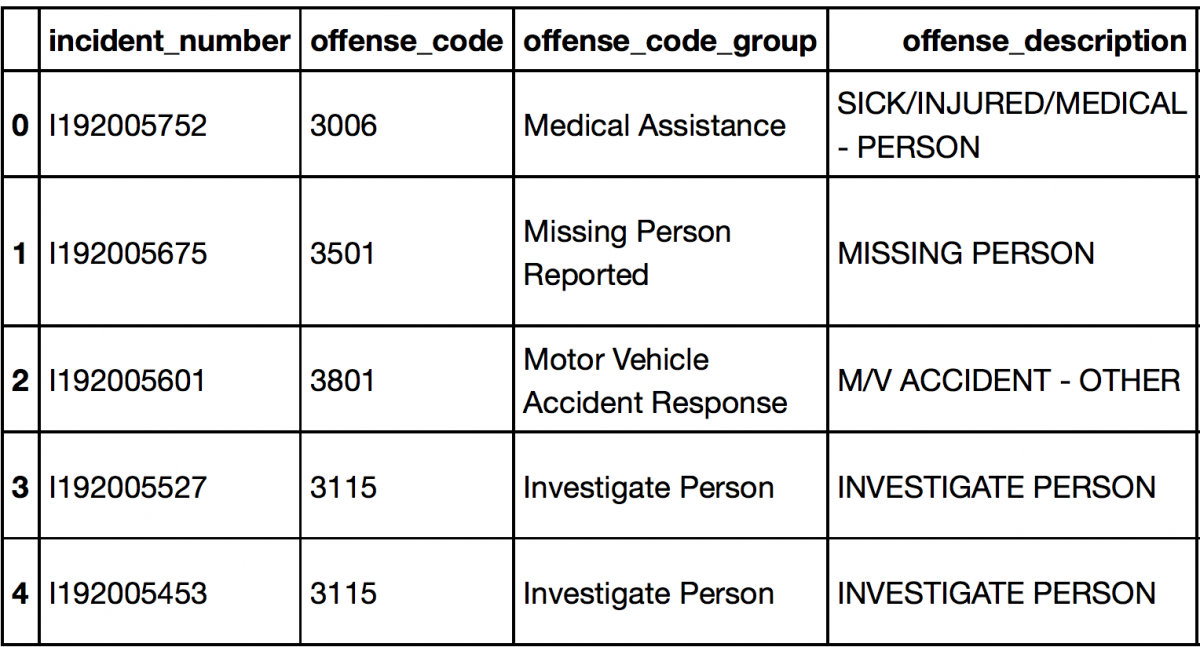
The pandas dataframe makes it convenient to select specific values in your csv.
crime['year'][0]

2019
crime['lat'][2736]
42.35331987
Next, select your latitude and longitude range. Since I am plotting a heatmap for 2018 Boston crime rates, I will choose the longitude range to be between -71.21 and -71, and latitude 42.189 to 42.427.
The first line of code below divides the longitude range into 100 equal intervals, and second line of code divides the latitude range into 100 equal intervals. These two lines are required because to plot the heatmap. We will input different crime rates into 10,000 cells on a 100 x 100 grid over Boston based on their locations. If you want to increase the resolution of your heatmap, feel free to use a 500 x 500 or a 1000 x 1000 grid.
Lon = np.arange(-71.21, -71, 0.0021) Lat = np.arange(42.189, 42.427, 0.00238)
First, we create arrays of 0s that are 100 wide and 100 tall to store crime rates.
Crime_counts = np.zeros((100,100))
Next, we select crime rates from 2018.
crime_2018 = crime[crime['year'] == 2018]
Next, we’ll organize the data.
The first for loop is created to go through all 2018 crime data. The second for loop is created to store crime rates by location. To do this, we go through latitude and longitude values for each incident. If lat-lon values of an incident match with one of the small cells in the 100×100 grid we created over Boston, we add 1 to that small cell. By the end of this execution, all locations will be recorded in one of the small cells in the 100×100 grid.
for a in range(len(crime_2018)):
for b1 in range(100):
if Lat[b1] – 0.00105 <= crime_2018[‘lat’].values[a] < Lat[b1] + 0.00105:
for b2 in range(100):
if Lon[b2] – 0.00119 <= crime_2018[‘long’].values[a] < Lon[b2] + 0.00119:
Crime_counts[b1,b2] += 1
To create the heatmap, you need to type in your Google API key. Instructions on how to create it can be found here.
gmaps.configure(api_key=”AI….”)
The pandas dataframe, the package we use to input data into gmaps, can’t take two-dimensional arrays per column. So we need to put the values of latitudes, longitudes and crime counts in 1d arrays.
longitude_values = [Lon,]*100 latitude_values = np.repeat(Lat,100) Crime_counts.resize((10000,))
heatmap_data = {'Counts': Crime_counts, 'latitude': latitude_values, 'longitude' : np.concatenate(longitude_values)} df = pd.DataFrame(data=heatmap_data)
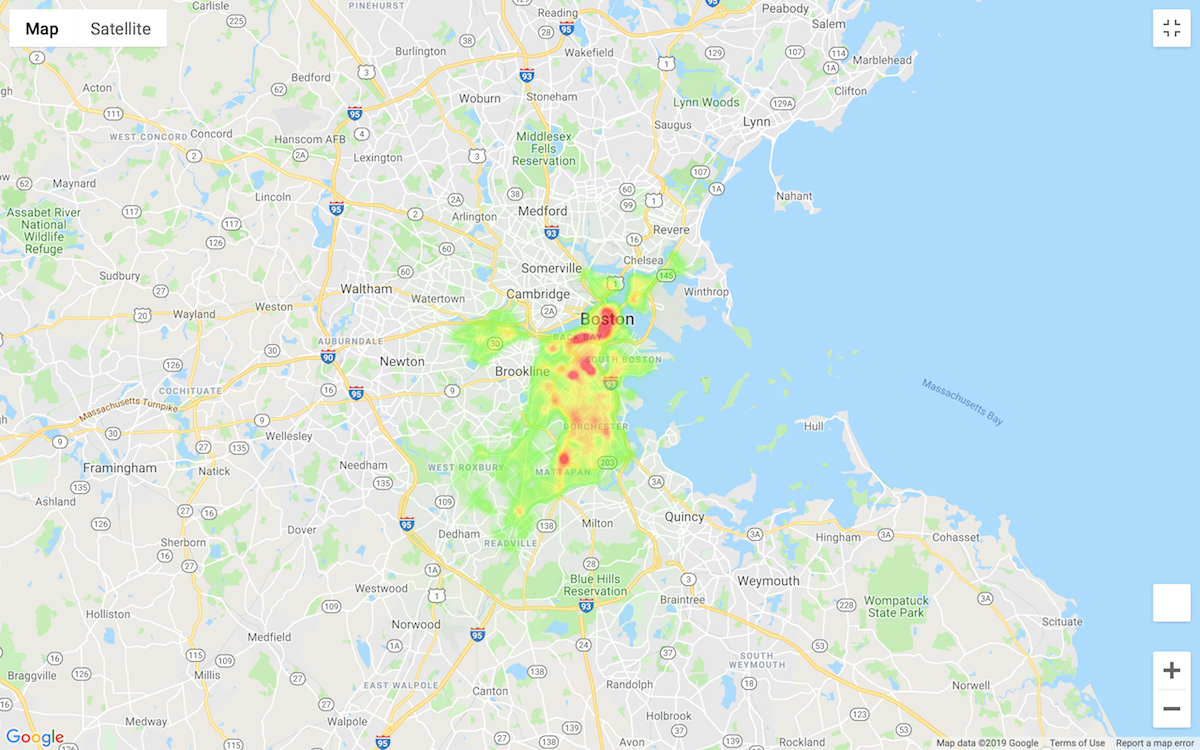
locations = df[['latitude', 'longitude']] weights = df['Counts'] fig = gmaps.figure() heatmap_layer = gmaps.heatmap_layer(locations, weights=weights) fig.add_layer(gmaps.heatmap_layer(locations, weights=weights)) fig
… and now we have a heatmap!
- What I learned applying data science to U.S. redistricting - January 20, 2020
- How to build a heatmap in Python - February 18, 2019
- The future of machine learning in journalism - January 2, 2019


Hi Floris,
I am a Python newbie. I have tried this in Idle and Pycharm 2019 Community edition. How and where does the heatmap display? I can run the program without errors but not get any output.
if anyone installed gmap for the first time they need to restart kernal so that maps can be displayed properly otherwise they will not be able to see any map
Hi,
This code is great, but I get the “arrays must all be same length” error. Please can you let me know where I’m going wrong?
Regards,
Plto77
same error i am also getting…u got solution or not?
hi, the same for me 🙁
Divide the difference in coordinates by 99 instead of dividing by 100.. you’ll get equal length arrays.
Hello, could you provide a link to the source code itself? Maybe upload it on GitHub/GitLab?
Thanks for the guide. I follow exactly but the heat map does not show. I am using Visual Code Studio. Any possible setting could be wrong?
Hi I think you need to use Jupyter notebooks and not VS Code Editor for this.