How PolicyMap is setting the standard for mapping data
Trying to create data maps can be frustrating and expensive, especially when you’re managing overwhelming amounts of data in a simple visual way. Maggie McCullough felt that there should be a simpler way to harness data and create useful maps. So, in 2008, she created PolicyMap.
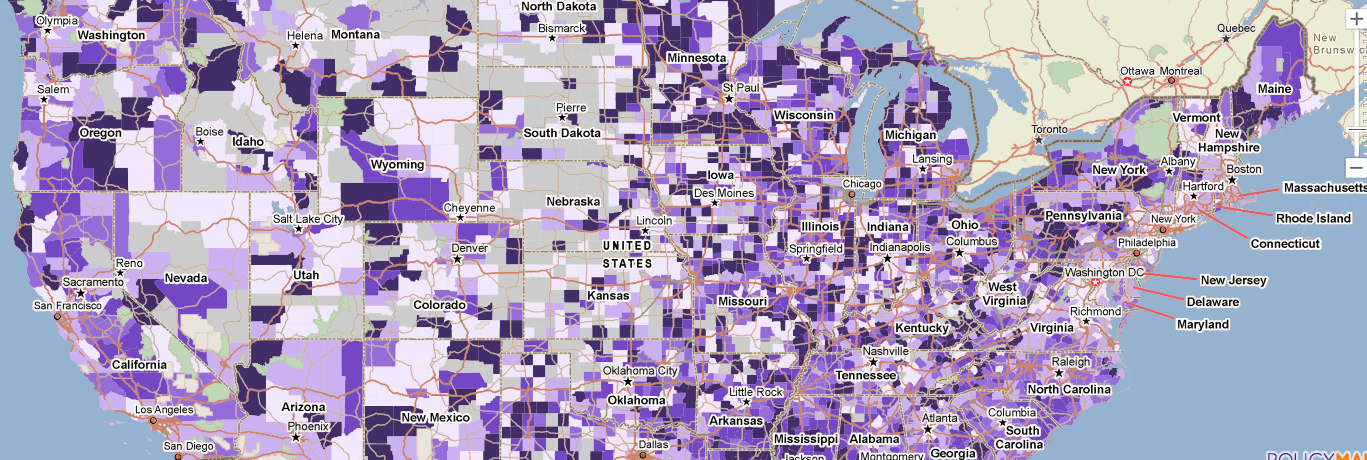
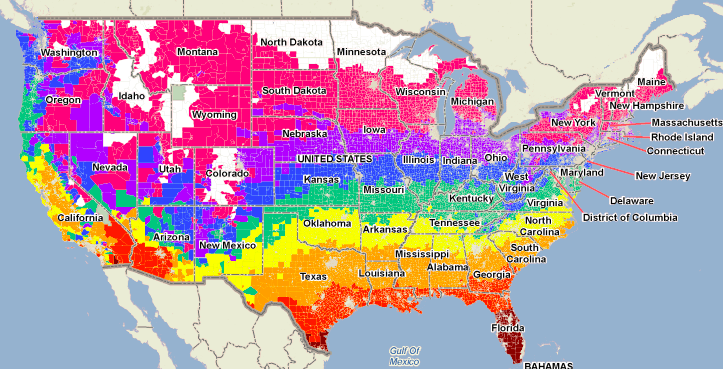
PolicyMap is an online platform that allows people to visualize maps for countless different economic and social statistics. Using both federal and third-party data and a simple user interface, PolicyMap hopes to change the way people think about mapping. Storybench recently caught up with McCullough.
What prompted you to create this company?
I was working at a place called Reinvestment Fund, a nonprofit bank. They had a small policy shop that would analyze impacts of different policies. We were always getting our hands on as much data as possible and mapping it out but it would be an expensive one-off project. I thought, “Wouldn’t it be cool if we could load all this data into a web-based platform and make it really easy for people to click on and off maps they need?” I saw the need for a simple tool to let people make data maps for themselves, which can get really expensive. Reinvestment Fund gave me the seed money to start it and we grew and grew.
How long did it take to create a finished product? Or is PolicyMap constantly growing and there really is no finished product?
There is no finished project ever. It took us about a year to soft launch. We didn’t have all our data, but if you wait to have it all, you’ll never be able to launch. We wanted to hear from customers and prioritize what they needed and see how they used the tools.
What kind of companies reach out to you for your services?
We sell to a few main markets. One is universities – including Northeastern – where schools have the library buy a license to PolicyMap for the whole university and all students and all classes can use it. We have about 160 universities as customers. The second market is government agencies. Healthcare is growing as well as a third market of subscribers.

How do you keep your data up to date and accurate?
We have a data team in Philadelphia of about five to six people. They are responsible for all the data that is in PolicyMap. Much of our data comes from the public domain (federal sources) where as soon as the federal source is updated we update our maps. Those federal sources are normally updated annually. We simplify all of our data for our customers with short explanations. We will normalize it so it’s not just the number of kids living in a certain area but the percentage of kids. We do all the percentages. Some data we license from third parties so we will pay for the data and they will load it in.
What have been the biggest challenges from conceptualization to now?
There is this expectation that everything on the web should be free. There has always been tension between what should be free and what should be for profit on PolicyMap. Even though we are a benefit corporation we do need to grow our revenues so we can hire more people to do more data work and grow our platforms. That means trying to get more customers. As a benefit corporation we are committed to having a free side and making the free side really good, but we’re trying to make a profit at the same time and that’s the biggest challenge we face.
What are future plans for PolicyMap? Any new projects in the works?
We are working on updating old technology, we’ve been using it for ten years and we’ve put off the rebuild for so long, but our current platform was built before there were mobile devices; it is very sturdy but works in an antiquated way. So we are in the middle of a rebuild and also working on improving our interface in ways that allow our customers to view data in different ways – not just looking at a map.
Is there anything you’d like to add?
The only other thing about our plans for the future is to start creating unique data that our users need that doesn’t exist anywhere else. We’ve done a really good job collecting and licensing data, but we want to create analytics that makes understanding communities even simpler.
- How PolicyMap is setting the standard for mapping data - November 19, 2018


