How a science search engine is visualizing the discovery process
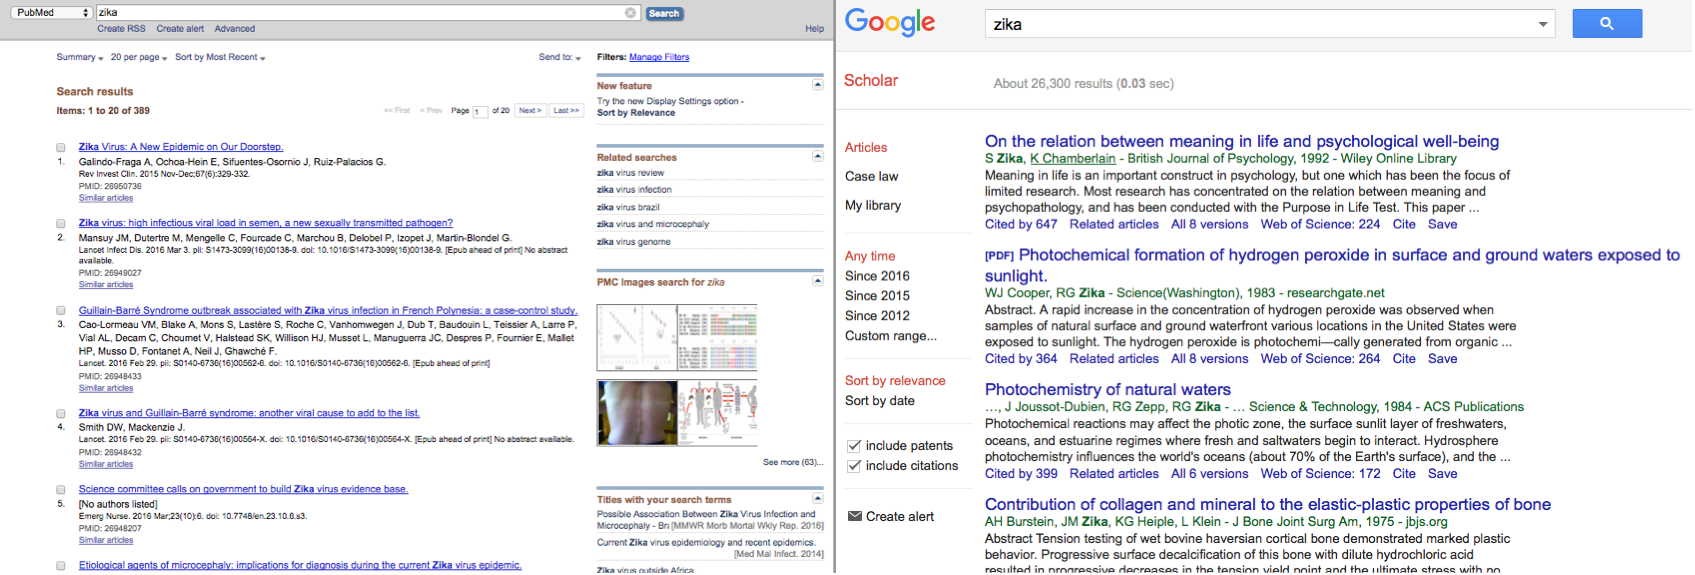
Scientists and journalists share similar skills and challenges in digital storytelling, especially when it comes to researching an unfamiliar field. Current tools for searching information from the academic world in particular can be difficult and time-consuming. PubMed and Google Scholar, for example, present searches linearly—a long list of things to sift through. And if you have no idea what terminology to use, this list can be quite daunting. Another method is to look up references listed at the end of a research study, though these citations are not always public.
For these reasons, a team of scientists scattered around the world have come together to create Blaze, an open science search engine that visualizes research fields as mental maps. These maps compartmentalize areas within a field and physically orient them based on how similar they are to one another. Blaze rounds up research publications from Public Library of Science (PLOS), an online publisher for numerous open access journals, for its search results.
Peter Kraker, who heads the project, wanted to improve digital research tools with data visualization. He seeks to bring research together and visualize it on a single map, saving time on research and making the discovery process more open.
Like Kraker, Mike Skaug worked in science research. “All along I had an interest in how information we’ve created is communicated visually,” Skaug said, “But I saw that a lot of times in science it was done poorly. Journalism is doing a good job in it.” He experimented with a few data visualization projects on his own before joining Kraker. Skaug is now the co-lead of Blaze.
For Kraker and Skaug, their biggest challenge in making Blaze was the user interface. They want someone to arrive at Blaze and not need any instructions on how to use it. For visualizing everything on one page, interactive mental maps made the most sense.
The team built Blaze with researchers in mind, but users don’t need to have a science degree to use it. The tool holds promise for anyone who wants to get an overview of a research field, from new students and seasoned scholars in neighboring fields to journalists and other lay audiences.
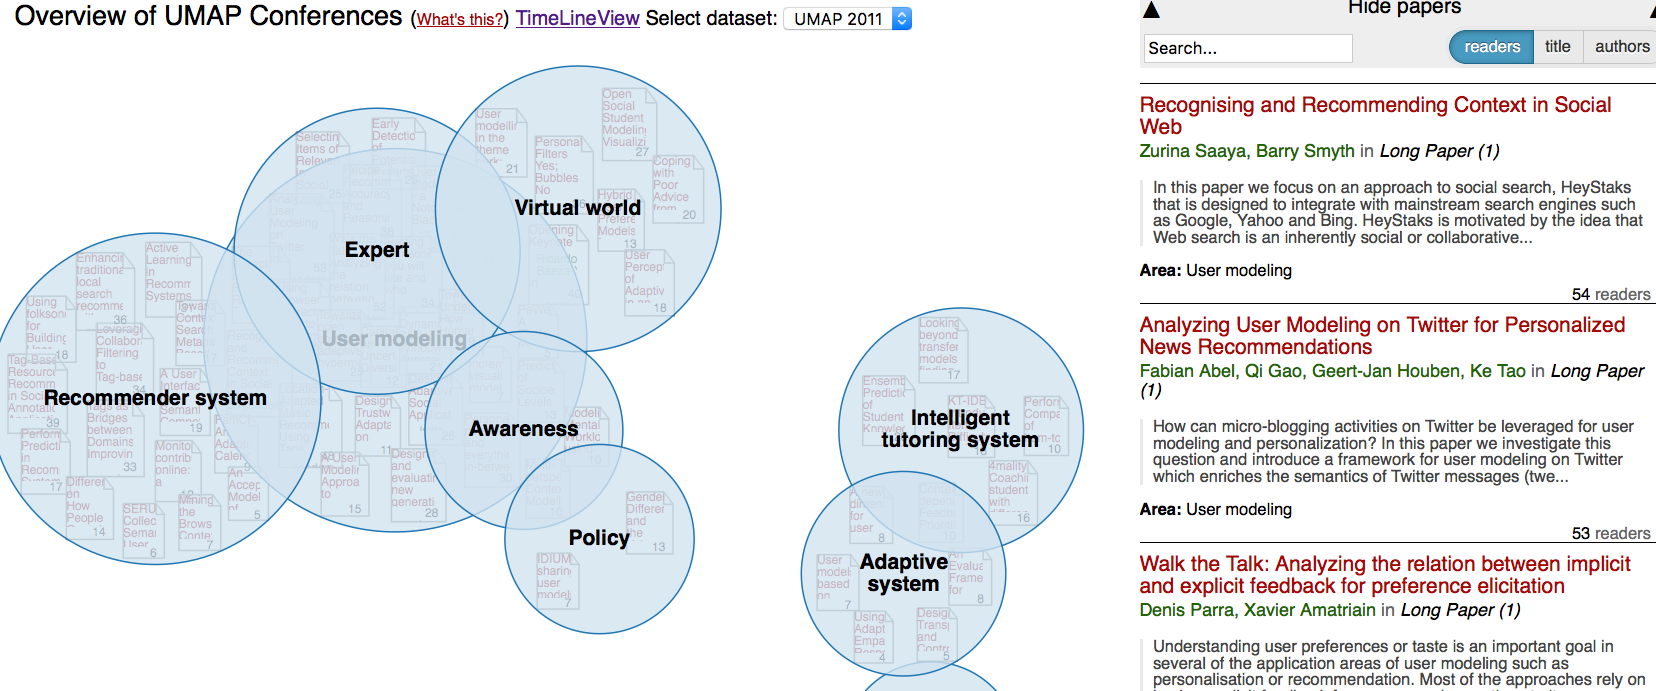
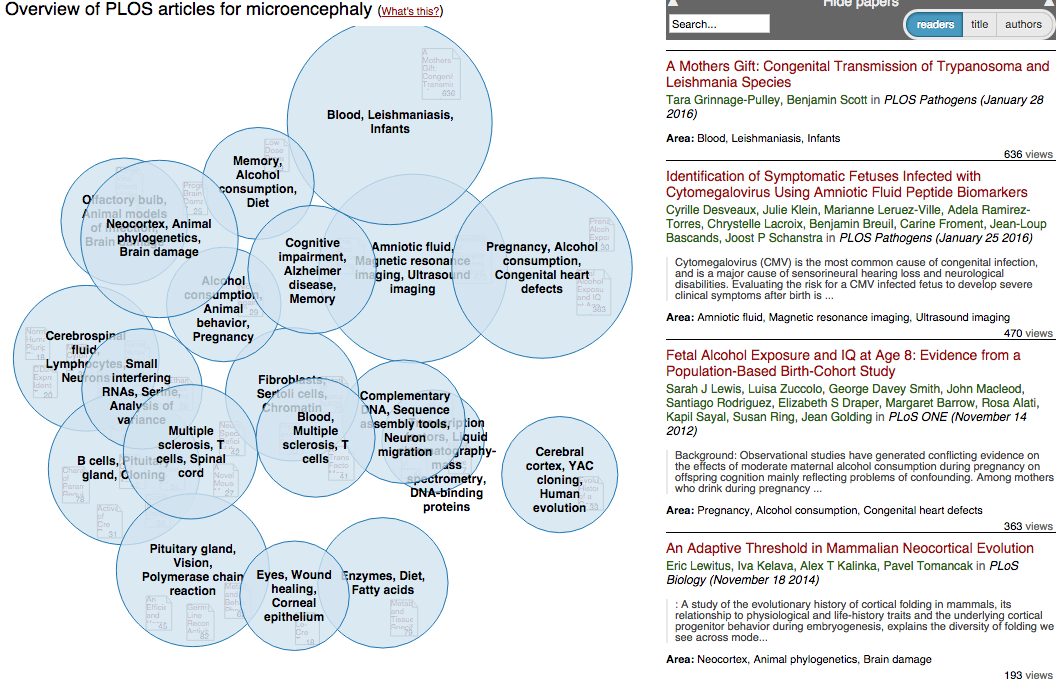
Imagine a first year Ph.D. student in biomedicine or science journalist researching the Zika virus. Her first step might be to get a lay of the field. On Blaze, she can type in “Zika” and see a map of bubbles corresponding to main research areas like virology, geographic distribution, education and culture. The closer the bubbles are to one another, the creators say, the more similar the topics.
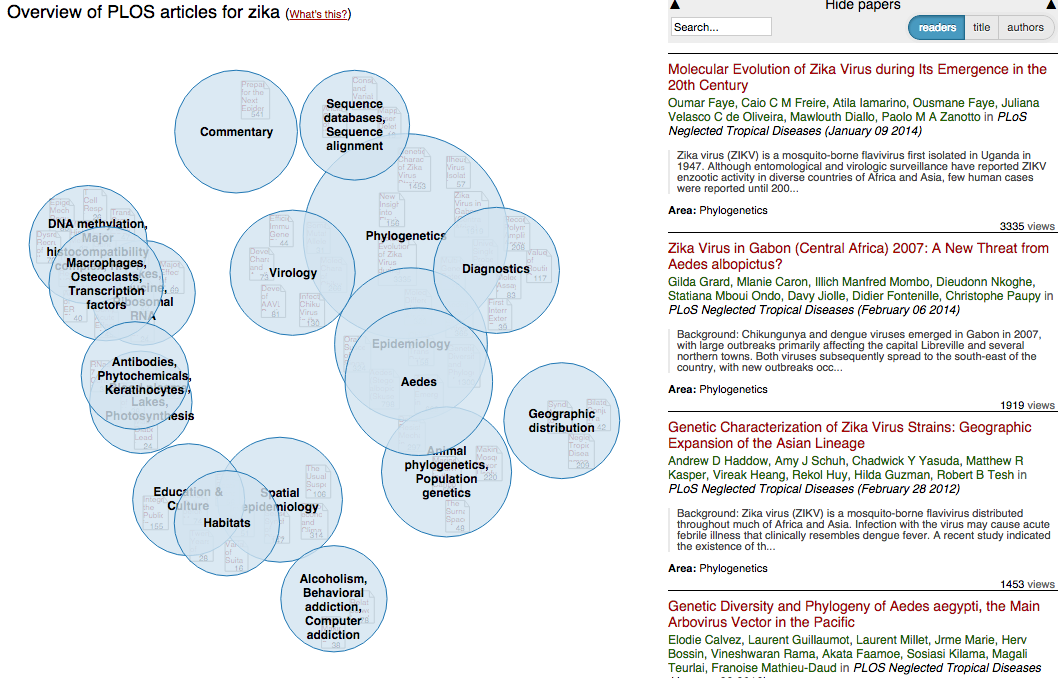
Blaze uses text mining to determine how bubbles are clustered on a map, which are in turn made up of publications and other media. That is, the greater the text similarity between one publication with another, the closer together they are grouped.
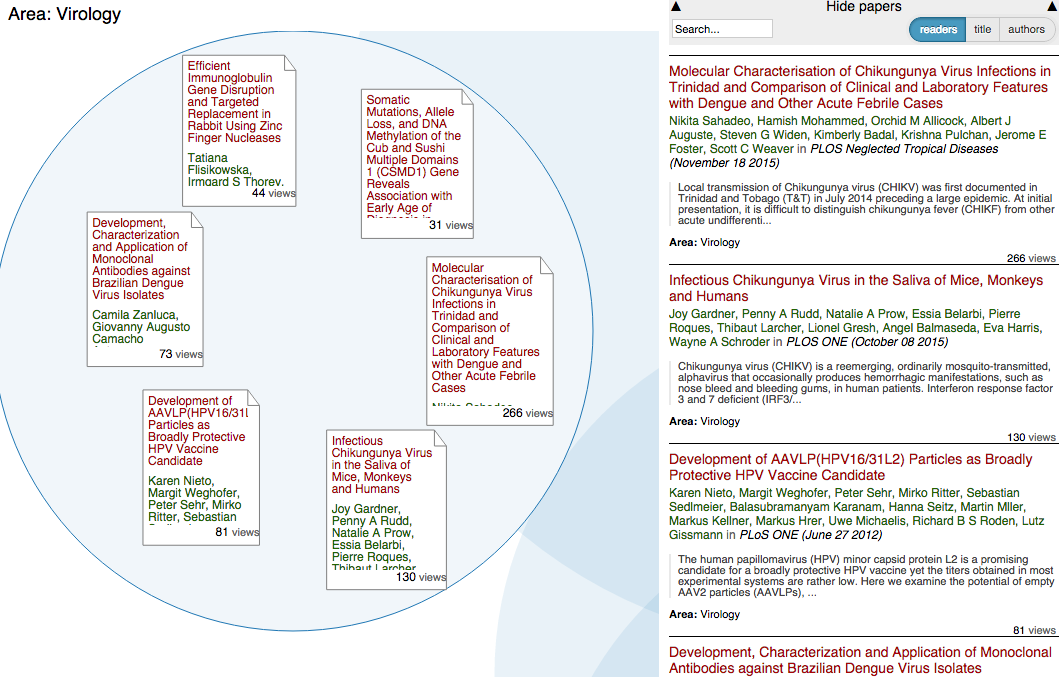
Within these circles are thumbnails of research articles, which in turn lead to full PDFs. The case of the first year Ph.D. student is one example Blaze proposed, and it could just as well be a scientist in a neighboring field or a journalist investigating Zika.
While Blaze launched in 2014, it is still in an early stage. The team has improvements in the works. One is creating a back button, to make zooming out of a bubble more intuitive. Another is refining the way that associated research topics cluster, which means making the bubble visualization easier to read and navigate. The more results, the more overlapping, as can be seen with this search for microencephaly:
More long-term plans include visualizing discovery over time and building an overlay that shows citation links between papers. They ultimately want to allow people to expand and refine maps, Wikipedia-style. Daniel Himmelstein, a bioinformatics graduate student at UCSF who is not involved with Blaze, sees potential in this idea.
“I’ll often work on problems for years before encountering seminal works that would have been helpful from day one,” Himmelstein said. “The [scientific literature search problem] is worst at the cross-section of fields as each field has its own specialized terminology.” He thinks Blaze may help solve this problem.
Due to copyright and licensing concerns, Himmelstein noted, not all research is available to create an open citation search engine. Currently Blaze only brings in research from PLOS, a small percentage of all peer-reviewed publications out there. The more text Blaze has to read, though, the better the clustering—this is an advantage to using full-text PDFs rather than just abstracts. Still, this marks a challenge, and its creators acknowledge this. “Do we stick true to open access?” Skaug asked, “or do we bring in closed stuff?” Either way, in the long run, Kraker wants Blaze to be as comprehensive as possible.
Kraker and Skaug think it’s important for scientists to be able to communicate with society and fellow scientists. Kraker can see Blaze included in outreach and research dissemination training programs, which would improve communication across different science disciplines.
“If we can bring in journalists and lay audience as well, that would be amazing,” Kraker said. “I’d really like to see people structure the world’s knowledge.”
Blaze, which is hosted on Open Knowledge Maps, is built from a D3 demo. A custom-built R package aggregates the research. Blaze is running for this year’s Open Science Prize. To watch their proposal, click here. To read it, go here.
Editor’s note March 16, 2016: This article has been updated to clarify which researchers developed the prototype for Blaze and what PLOS research the platform publishes.