Seven visualizations that tell the devastating story of the 2017 hurricane season
First it was Harvey. Then it was Irma followed by Katia, Jose and now Maria. From late August through early September, the Atlantic Ocean has seen 13 named hurricanes. Two of those – Harvey and Irma – became major hurricanes and made landfall in the U.S.
Hurricane Jose, while not predicted to be a major storm, is currently bearing down on New England and remains a Category 1 storm. Hurricane Maria, on the other hand, is gaining strength in the Caribbean and has its sights on nations that are already dealing with extensive damage from Irma.
Although this time of year is always the peak of hurricane season, the following graphics illustrate just how extreme and costly these recent disasters have been.
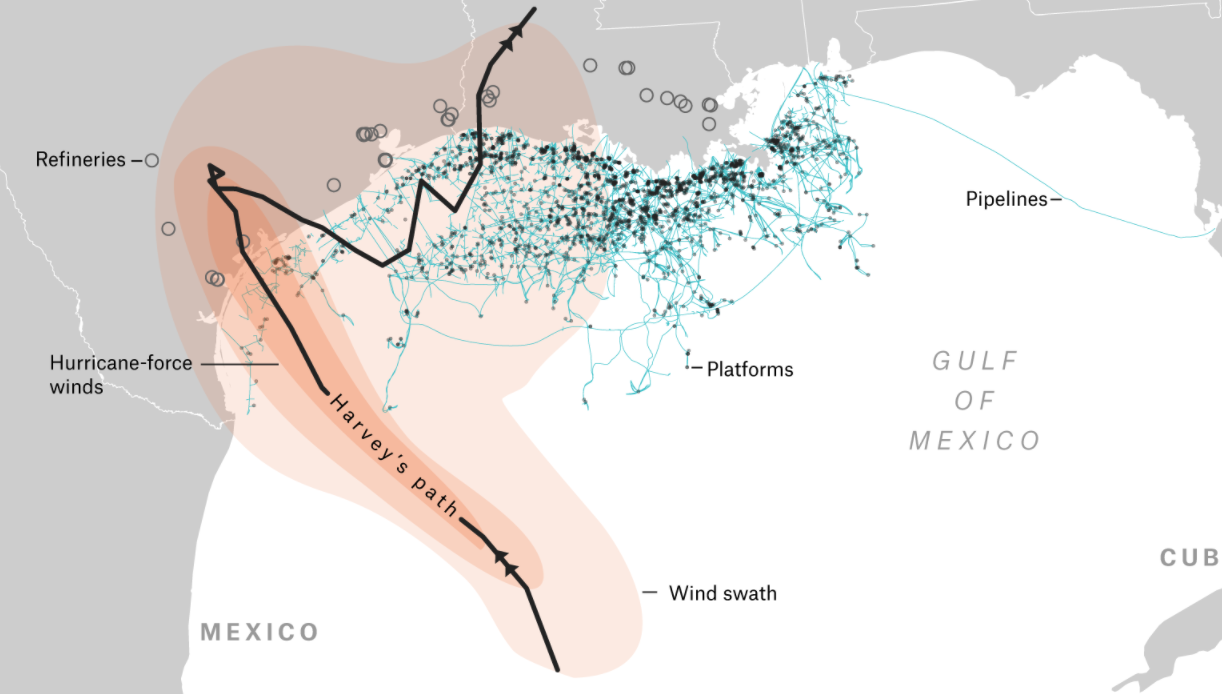
“Harvey’s Impact on the Oil Business”
FiveThirtyEight
FiveThirtyEight’s coverage of Hurricane Harvey’s impact includes graphics that illustrate the economic impact, including this one that shows how a large part of the Gulf’s oil infrastructure was impacted by the storm, contributing to rising gas prices across the U.S.
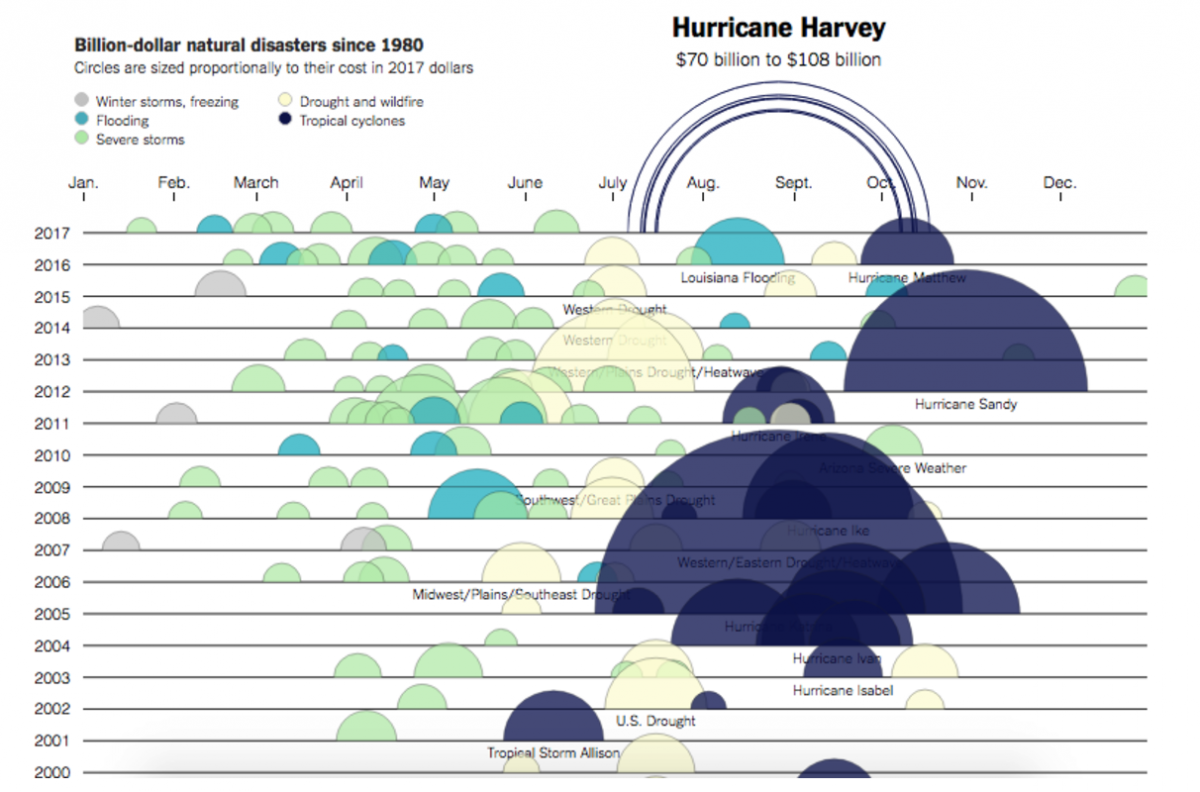
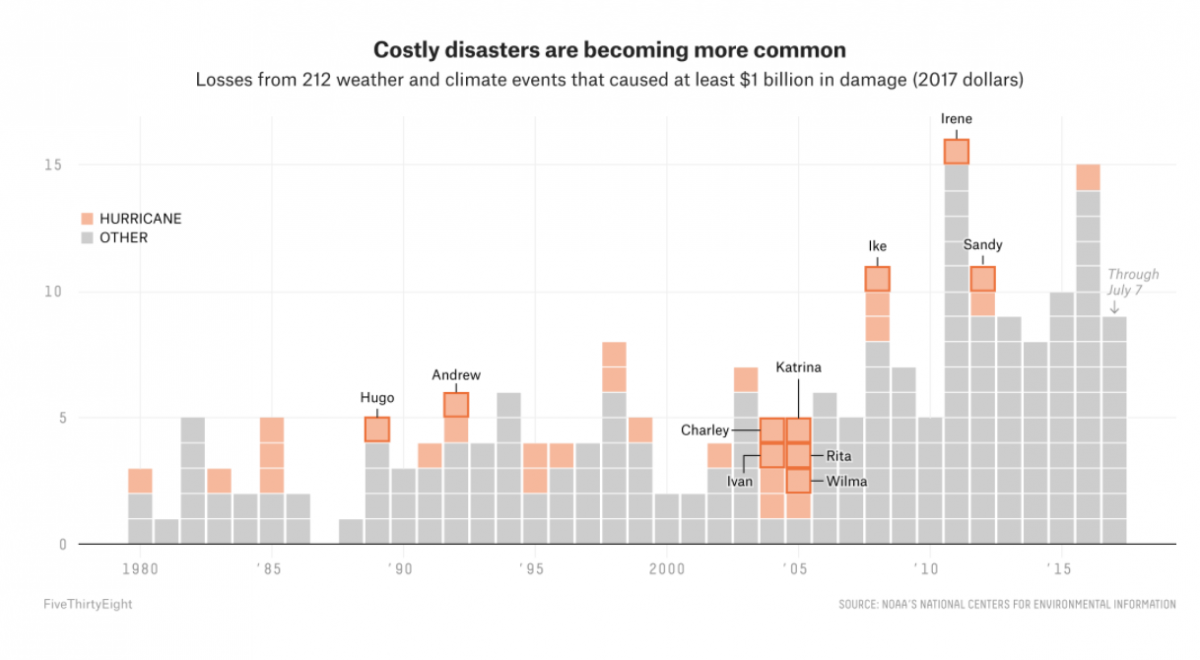
“The Rising Cost of Natural Disasters”
The New York Times
The Upshot’s interactive graphic illustrates the cost of billion-dollar natural disasters since 1980. One sees that hurricanes, in particular, such as Katrina, Sandy and Harvey, are among the costliest and the costliest in recent history.
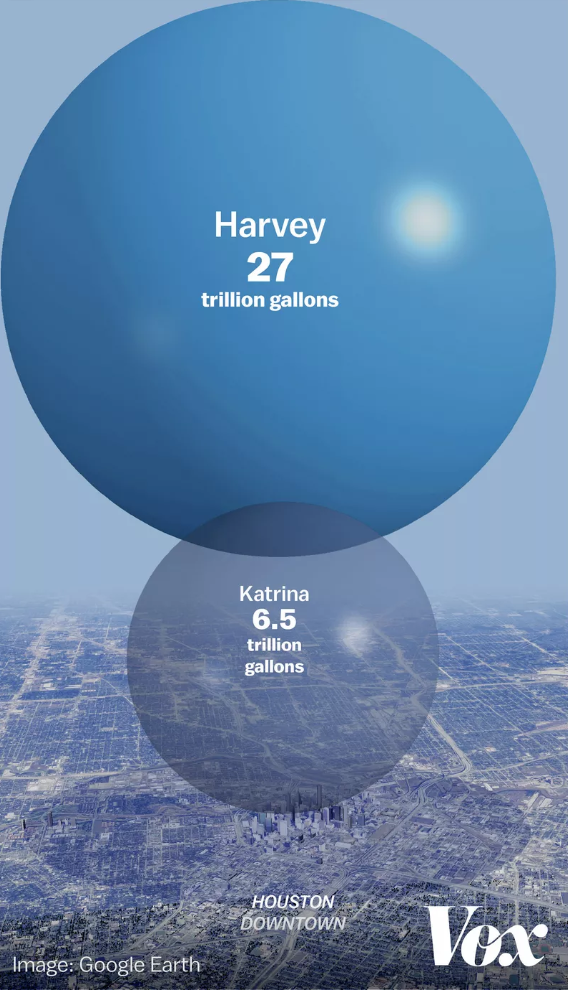
“Visualizing Just How Much Rain Came With Hurricane Harvey”
Vox
The images of the massive flooding in Houston following Hurricane Harvey shocked the nation, but just how much rain actually fell? True to their “understand the news” mission, Vox illustrates just how much rain the storm dumped on Texas and Louisiana- 27 trillion gallons, or nearly one million gallons for every person living in Texas, with this image.
History of Hurricane #Irma: 1 September 2017 – 10 September 2017 #GOES16 pic.twitter.com/Z53paEmpIY
— NASA SPoRT (@NASA_SPoRT) September 11, 2017
“Hurricane Irma Forms into a Monster Storm”
NASA
Using satellite imagery, NASA SPoRT (Short-term Prediction Research and Transition Center) created this animation detailing Irma’s formation in the Atlantic. Irma became the strongest easternmost Atlantic hurricane since Hurricane Dean in 1979. The animation shows Irma’s path of destruction over the Caribbean islands before making another landfall on Florida’s west coast. Hurricane Jose is seen forming in the tracks of Irma.
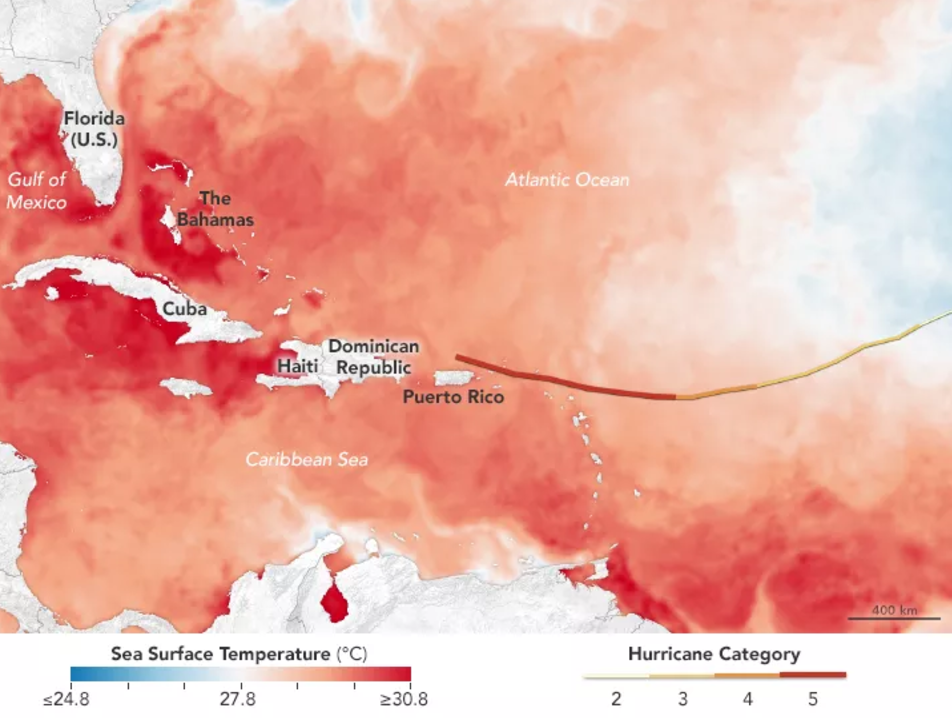
“Ideal Conditions for a Major Storm”
NASA
Warm ocean water is a vital ingredient for hurricane formation. This eye-catching graphic, created by Joshua Stevens at NASA Earth, clearly illustrates how Irma had a readily available supply of warm water as the storm moved across the Atlantic Ocean and Caribbean Sea, contributing to its formation into a Category 5 hurricane with wind speeds of 185 mph.
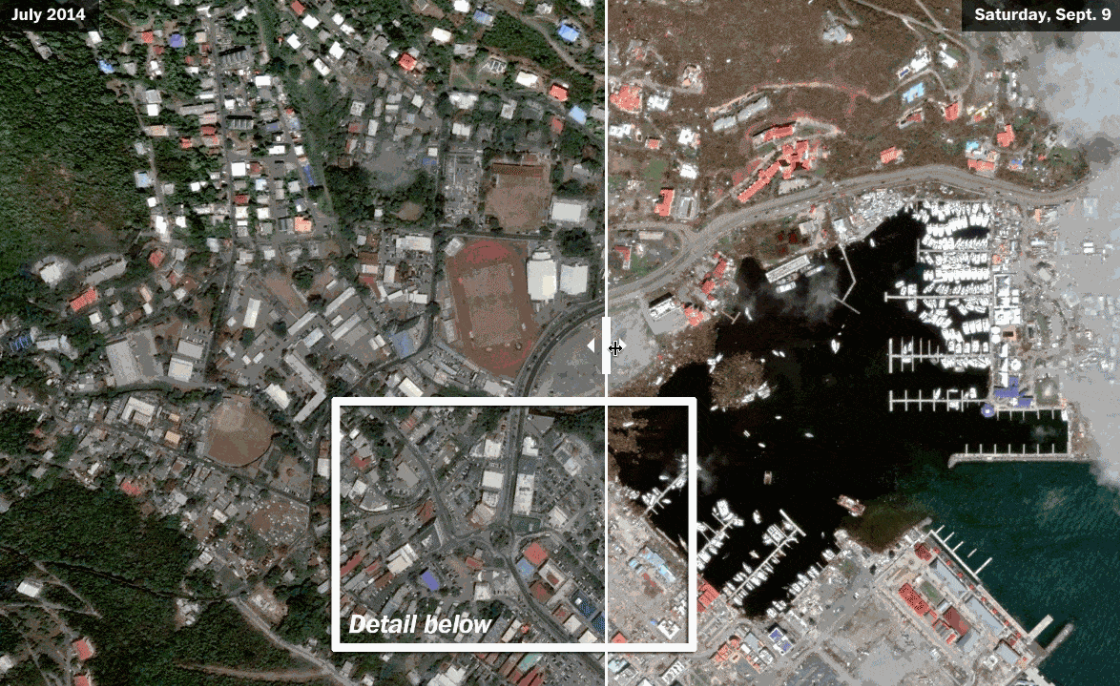
“Irma’s Devastating Damage in the Caribbean”
The Washington Post
This satellite footage captured by NASA illustrates the magnitude of the devastation left behind by Irma on the island of Tortola, part of the British Virgin Islands. This Washington Post article provides before and after pictures with sliders, revealing extensive destruction. Many of the Caribbean nations affected by the storm experienced widespread food, water and medicine shortages.
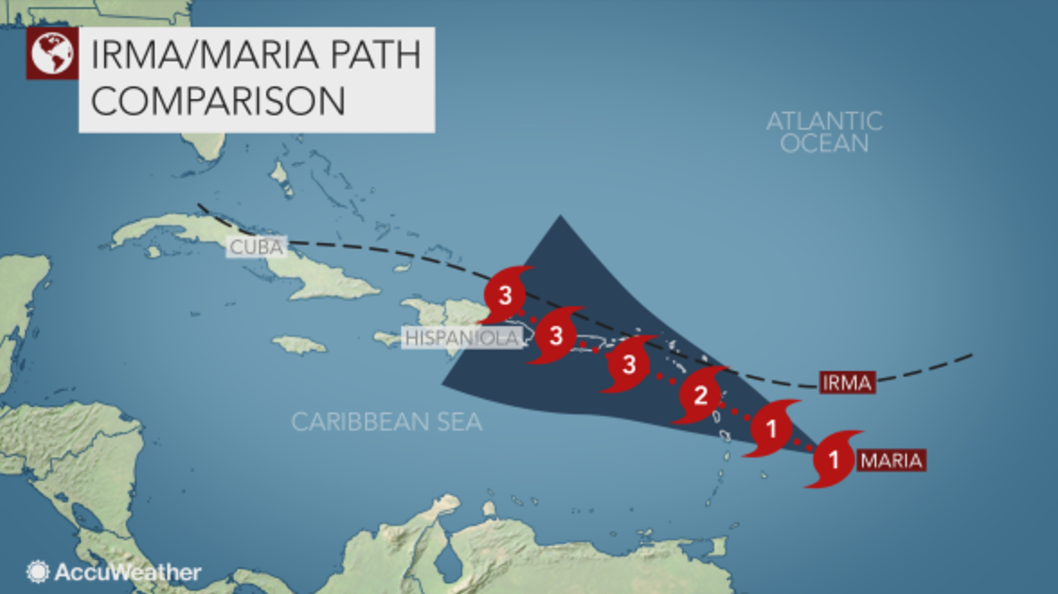
“Hurricane Maria: Following in Irma’s Footsteps?”
Accuweather
Caribbean nations affected by Hurricane Irma barely had time to blink before Hurricane Maria formed in the Atlantic and made a beeline for many of the same areas that Irma devastated last week. While forecasters are still tracking the storm’s path, the National Hurricane Center has issued a public advisory, with many of the nations hit by Irma now under another hurricane watch or warning.
Cover photo: FiveThirtyEight.
This post has been updated to correctly attribute a visualization to NASA.
- Seven visualizations that tell the devastating story of the 2017 hurricane season - September 18, 2017