The Guardian wants to know what global sustainability goals you would prioritize
In 2015, the United Nations released 17 sustainable development goals centered around people, prosperity and the planet. So far, 193 countries have committed to this transformation by 2030. Now 10 years away from the UN’s targeted goal, the question arises: How much progress have these countries made?
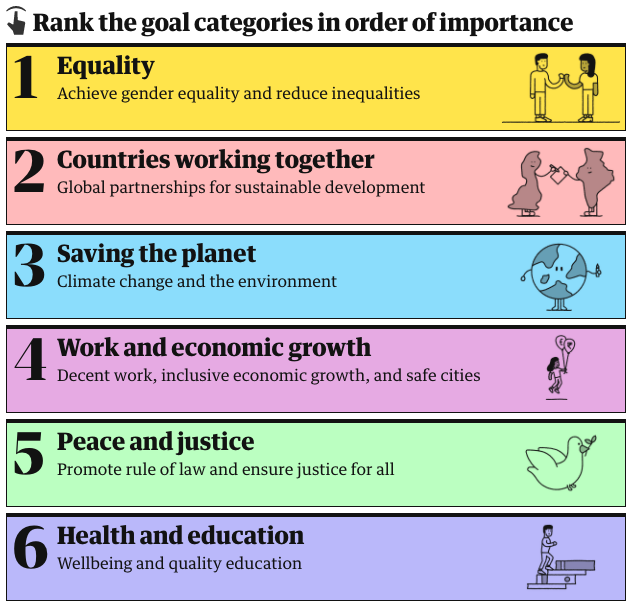
The Guardian kicked off 2020 answering this question. A five-member team consisting of visual developers and editors came together to create an interactive quiz that allows users to pick a country and then rank seven categories in order of importance: equality, countries working together, saving the planet, work and economic growth, peace and justice, health and education, and eradicating poverty and hunger.
Once users rank the categories, each one expands into a list of goals and the countries on track to meet these goals. For example, the goals for equality are to achieve gender equality and reduce inequalities. The nations on track to meet these goals are Finland, Sweden, and Norway. This quiz also computes how the user’s priorities compares to other participants’ priorities. At the end, the piece lists the most popular top priorities among all participants.
Storybench spoke with the Guardian’s Visual Projects Editor Lydia Smears, Global Development Deputy Editor Liz Ford, and Interactive Journalist Niko Kommenda about the inspiration behind the interactive quiz and the greater story it told.
How was the idea pitched to focus on the United Nations’ 2030 target transformation? Where did you draw inspiration?
Lydia Smears: On the Global Development desk, we’ve followed the crisis of the sustainable development goals (SDG’s) since they were first mentioned in 2012. After they were all signed in 2015, we did sort of an explainer of what the goals are. It’s a bit unwieldy and difficult to communicate that message. So given that we’re in 2020, there’s a bit of an impetus now, since there is a 10-year countdown. So I said we need to maybe try and do something that could actually engage people, because in theory it is something that could impact everyone. [We were] thinking, what can we do that might be interesting and take something essentially that’s really quite dry and and big and actually make it into something that could be fun? Fortunately, we know that we have an amazing design team to help with this.
Going off the theme of “fun,” who designed the cute animations that went with the interactive quiz?
Lydia Smears: It’s quite confusing. There’s a design team at The Guardian, and there’s also a visual team. We are the visual team, Niko and I work on the team. We have our own designer, his name is Frank and he did the design, the colors, layout and illustrations.
And then you, Niko, and Gary worked together to build that design?
Lydia Smears: Yes, me, Niko, and Gary did.
So Niko, how did you build this tool and what tools did you use to compile all the data? How can other journalists take it upon ourselves to do something like it or follow in that direction?
Niko Kommenda: The data side of it is handled by a sort of script that we wrote a year or two ago and we use on a range of interactives similar to this quiz. The first project we built it for was a so-called “perceptions quiz.” We asked people to answer questions about their own country, like what do you think the level of unemployment is out of 100 prisoners in your country? How many do you think are foreigners? Stuff like that. That’s when we first tried it and we wrote that code ourselves. We made sure not to store any sort of personally identifying information about users. So it’s literally just recordings of the things you put in the interactive. We did things like, how would you rate these politicians’ performance? We had a very successful interactive called “How Populist Are You?”
How long did it take you to build this specific interactive quiz?
Group: Three weeks or so.
Was it more on Frank’s side that the quiz would have users rank the importance or did that unfold as you all were creating it?
Lydia Smears: That was Liz and I. We discussed very early on how to do this, how to make the information clear since the SDG’s are famously a huge volume of information. And some of it is quite depressing. Some of it can be uplifting, but it’s an overload of information. Some of that information is incredibly specific. We talked about that and the way to maybe put the goals into categories. [We wanted to] the readers the option of looking at all the information if they want, but if they want to just browse a little bit of the information, they can. I think what was brilliant about this is it looked nothing like the UN’s SDG goals page or site. The quiz was very Guardian – even though we’re just taking that information – which was really cool.
When I first took the quiz, I loved the drawings, as I mentioned before. And I know that Frank created those. But how do you think those contributed to the piece as a whole?
Lydia Smears: Well, I think those drawings were really key because they were cute and they were engaging. The topics that we’re looking at, such as inequality or hunger or climate crisis, were quite serious topics. So this was a way of signaling to readers before they even clicked on the page that this is going to give you something that maybe isn’t a horror story. You know, it indicates to people certain things about the tone of the piece and also the fact that it’s going to be quite fun. Frank did these illustrations by hand, it took him about a week, maybe less than that.
Liz, as the deputy editor, what considerations were you making throughout the process?
Liz: I think there’s always been quite a little bit of faith in the visual and design team to come up with something that would work. I think my contribution was getting all the information to the team in time. You get bogged down with all the details of the SDG’s, and sometimes you just need to pull yourself up. At the editorial end, we had four pairs of eyes on our desk. So it was not really the mechanics of it, our end was making sure the text was correct and it all made sense and it was free of typos.
Now that users are interacting with the quiz, how is the audience responding? Do you think it makes them feel more part of the effort versus just reading it?
Lydia: That was a really important part of the conception of the piece,. One way of getting people to read quite long pieces of content is to put them into the picture, so asking people to rank goals in a way that’s also a little bit of fun. Also, if a piece can show someone something about themselves – whether it’s in a way their opinions fit into the broader picture – they’re more likely to spend more time on that piece because you’re not just didactically explaining some things that you’re saying.
Do you think this piece is a sort of call to action for people to look at their individual countries, see what their challenges are and how they’re aligning with their goals?
Liz: I would say indirectly, because we’re not saying to people directly that they need to eventually go and do something. It’s sort of an encouragement. And the reason that we had people’s country goals was so they know where their country [stands] or how their country is doing. The whole point of the SDG’s is that they apply to every country. And I think that message isn’t necessarily relayed across. If you’re clicking where you’re from and you’re finding that actually we’re doing very badly on this – and you thought you were doing quite well – then that gives them [the idea] that maybe they will mention that when the next politician is knocking on their door or something. It’s interesting to make a point that this isn’t about poor countries, this is across the board. And I think that from an editorial point of view, that’s quite important.
Niko, for this script that your team built that’s completely internal to The Guardian, would you say that there’s any platform out there that you can kind of relate to?
Niko: I think I remember the New York Times doing something similar, which first prompted us to build this thing. But I wouldn’t know anything about the sort of technical architect behind that. So we built our platform pretty much from zero. We were the first ones to kind of have the idea. I think I’ve seen other newspapers do similar sorts of quizzes.
Do you share an external name for this platform that your team built?
Niko: Interestingly, no. Obviously it helps when people know what we offer. We have this problem frequently actually when we have a sort of format of story or interactive, that maybe people want us to build but we don’t quite know how to refer to it. And in these cases it would be really helpful to have a sort of codename for a type of interactive or a tool. So maybe we should think about naming it. But for now it’s just the interactive quiz server.
How long did the platform take to develop at first?
Niko: A couple weeks, I would say. And since then it’s gone through a couple iterations, so we tested it on some very small projects initially. One of them was the populism quiz that got several million hits. That’s when we stress-tested it for the first time, but everything went well. Since then, we’ve added a couple of features.
Does it take you three weeks normally to create a new piece or is that based on dataset and the timeline can vary?
Niko: It can vary, but it should take us less and less time as we are working on it. Once you kind of wrap your head around the structure of that database, if you make a new project, it’s fairly easy now to plug that in. So you got the data that your users will be submitting, and you come up with the kind of summary you want to generate from that, and writing the code should be fairly straightforward.
One thing that really stood out to me as I was going through the quiz, I noticed the percentage in the upper corner saying how many other participants agreed with the user. How is this script collecting that data?
Niko: Your own answer is not going to be immediately included. Essentially, the server every couple seconds summarizes all the answers that have come in so far and writes out a new summary file somewhere to a different server. That’s what you’re loading in when you first load the page. So your own answer is not immediately going to show up. It would be if you want to refresh a couple seconds later, but there are various sorts of levels of delay between.