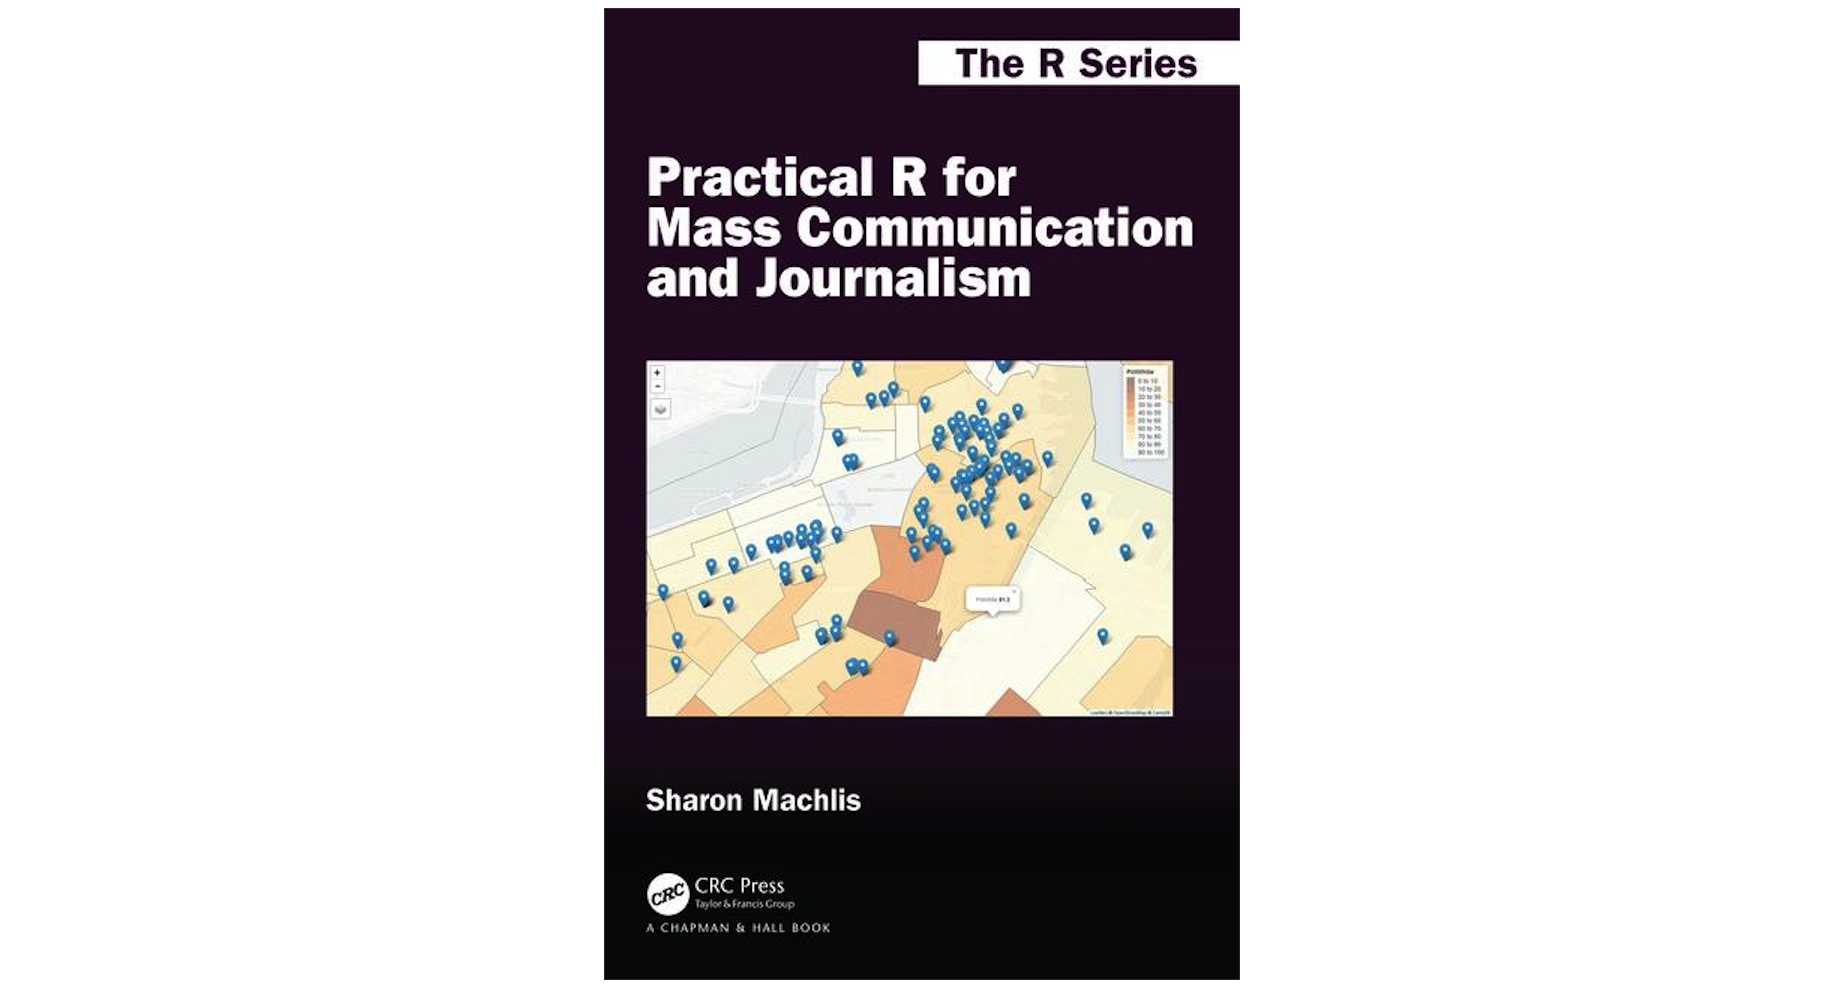
Why Sharon Machlis wrote a book on R for journalists
Since Sharon Machlis published her book “Practical R for Mass Communication and Journalism” last December, at least one professor is already using it in his course at the University of Arkansas. Renowned data journalist and data visualization expert Alberto Cairo, a professor at the University of Miami, reviewed the text online: “I NEED THIS BOOK. I may adopt it as a textbook.”
Machlis, director of editorial data and analytics at IDG and a self-described R enthusiast, said CRC Press reached out to her about writing a book for their R series. She immediately knew she wanted to tailor it to journalism.
“The first thing you have to do is decide who the audience is,” Machlis said. In the introduction, she writes her book is for three main audiences:
- Spreadsheet users who want to learn their first programming language.
- People who know another programming language but want to learn R.
- Communications professionals and journalists who already know R but want to learn new ways to use it.
“I’m especially interested in trying to coax the power-Excel users into the next level of their data work,” Machlis said. “But I’ve heard from people who already know R that they’ve found some useful things in there, so I’m very happy about that.”
Machlis spoke with Storybench about “Practical R for Mass Communication and Journalism” and how it will sustain in the ever-evolving R landscape.
How do you teach R in a way that’s different from other texts?
A lot of R texts are statistical texts and the point of the book is to teach statistical theory, which is also very useful, but if you’re a practicing journalist you might want to know how to use it to report election results, or how to use it to look at restaurant inspections and see certain things. So those are the kinds of examples that I try to use.
One of the examples I use in the book is unemployment data—data that you get weekly or monthly. And if you set up the script once, then every time the data comes you kick it off and it’s done. You don’t have to redo everything manually in the spreadsheet. When I started working in R, my initial reaction was “Why didn’t anyone tell me about this? How did I not know about this?” Now R is pretty popular, but at the time about 6 or 7 years ago it wasn’t really well-known.
In the process of writing the book, how did it all come together?
R is a very broad topic and there’s a million things there. I did have to narrow things down. In fact, I started off adding a chapter about linear regression. I decided there’s only so much you can teach in an introductory text, and maybe that’s for another time or another book—someone else’s book. Because what you don’t want to do is teach people a little statistical theory without the caveats and then have people run off and run tests on things without actually understanding what the tests are and the limits of the tests and which data you shouldn’t be using the tests on. And that just got to be a little overwhelming in terms of trying to fit that into an introductory text. So that was one compromise I had to make. But it’s tough. As someone who’s used to being a newspaper journalist or a magazine journalist now working on the web, you think, “Wow a book is awesome, everything I want to say I can put in the book.” But that’s not so.
How are you avoiding having the book go out-of-date soon?
R is a very fast-moving language. There are a lot of new packages, a lot of changes. At some point I think the publisher will be interested in second edition. For now, what I’m doing is I have a website for the book on GitHub and I’m adding additions and corrections and other interesting things I find to that, and I have a link to that in the book. I have a lot of additional examples of stories using R. As they publish, I try to add those in. I’m fortunate that there haven’t been too many changes in structural, important packages. But I’m guessing that’ll happen at some point and I’ll put the information up there when it does.
What impact do you hope the book has on the computational journalism community?
I hope a good one. I think if nothing else it’s a confirmation that R is a useful tool for journalists. At the NICAR conference that happened a week or so ago, I counted: there were 16 sessions related to R this year. That’s a lot. Five years ago maybe there were five. It’s another sign that there’s growing interest in using R as well as Python, which is another great language. I think the general idea that while every journalist doesn’t have to know how to code, I do think every journalist should know how to use Excel. But every journalist who is serious about working with data at some point will run into the limits of excel and will have to decide what to do.
Is there anything else you’d like to add?
R is a very welcoming and generous community and that is another one of the appeals. The community welcomes diversity, the community welcomes newcomers. There are a lot of very smart people who are very generous with their time in terms of answering questions or writing cool packages, and that is another appeal. When you decide to focus on a platform, it’s not just the technology: It is also the community.


