How to do basic text mining using Google Sheets
While techniques for text mining, sentiment analysis and other natural language processing are ubiquitous on the Internet, they’re not always accessible to students. I recently ran this tutorial in my journalism class at Northeastern University to help students answer some questions they generated around the Twitter timelines of the Democratic candidates running for U.S. president in 2020.
This simple-to-use technique employs two simple formulae: =REGEXMATCH(C2, “keyword”) and =COUNTIF(J2,”TRUE”) to answer questions like “When and how do the candidates talk about race, guns or climate?”
Getting the data
I used R’s “rtweet” package and this Storybench tutorial to access the Twitter timelines of 11 Democratic candidates running in the 2020 election. You might want to use datasets like Donald Trump’s tweets or State of the Union speeches.
| candidate | tweets |
| amyklobuchar | 919 |
| AndrewYang | 782 |
| BernieSanders | 662 |
| BetoORourke | 781 |
| CoryBooker | 768 |
| ewarren | 915 |
| JoeBiden | 914 |
| JulianCastro | 496 |
| KamalaHarris | 879 |
| PeteButtigieg | 623 |
| TulsiGabbard | 864 |
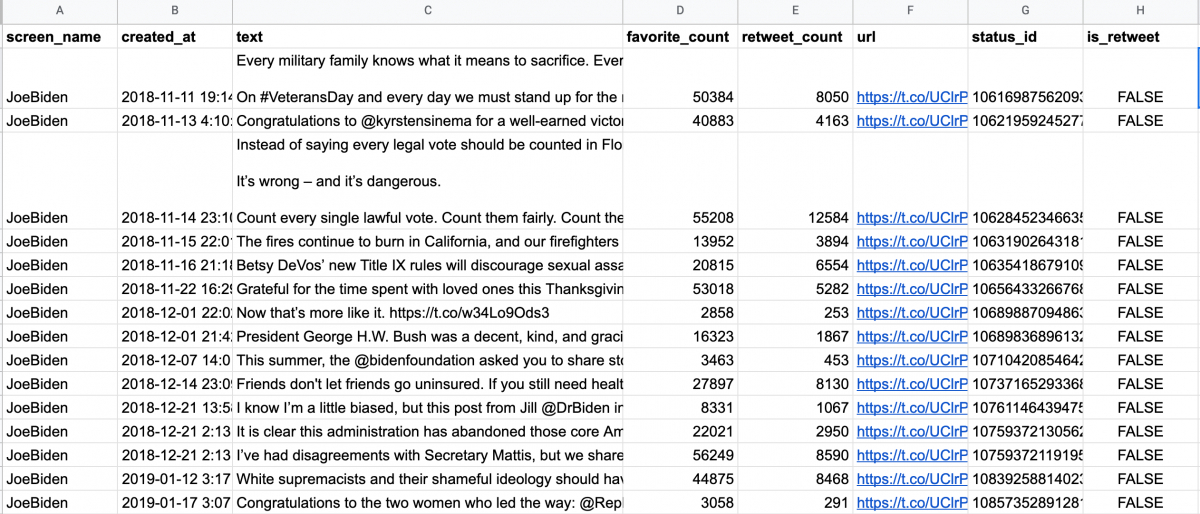
I then cleaned and dumped these 8,603 tweets into a Google Sheet and shared it with my students: bit.ly/digisoc2020tweets.
Looking for a specific keyword
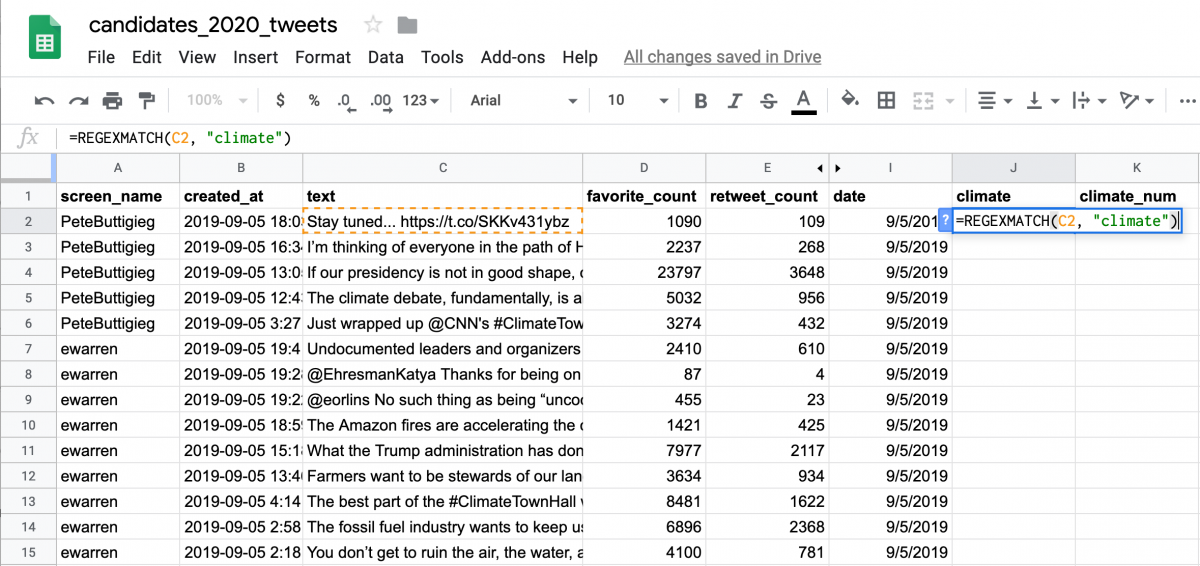
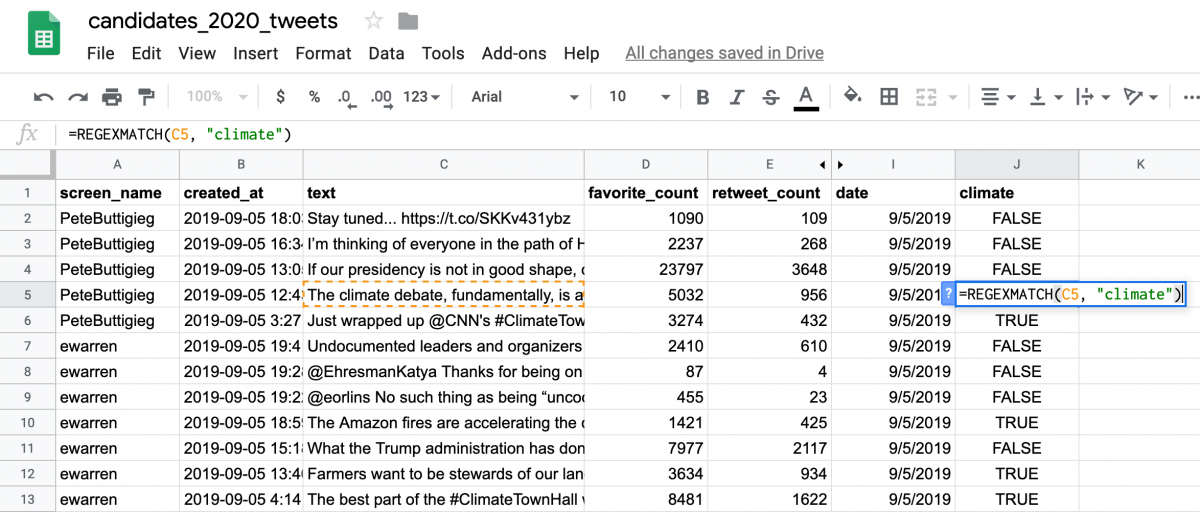
Next, I inserted a new column named “climate” – or whatever keyword you’re looking for – and used a REGEXMATCH formula to look through the text of tweet (which I is stored in column C) for the presence of a specific word. That formula, =REGEXMATCH(C2, “climate”) , returns either TRUE or FALSE. (Note: I’ve hidden columns F, G and H).
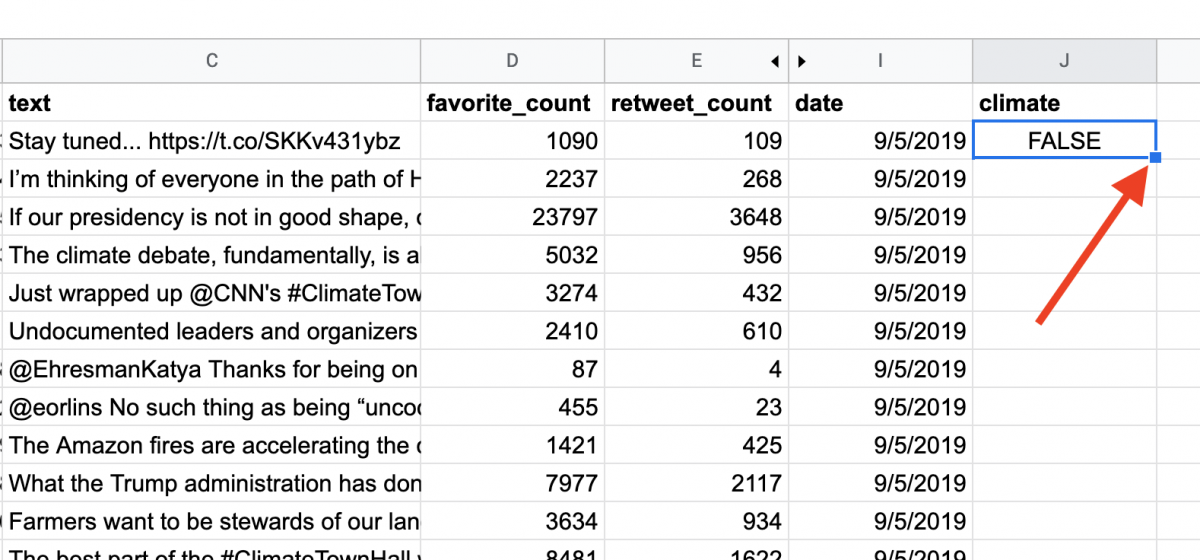
Next, we’ll apply this formula to all tweets by double-clicking the bottom-right of the J2 cell where I’ve placed the formula.
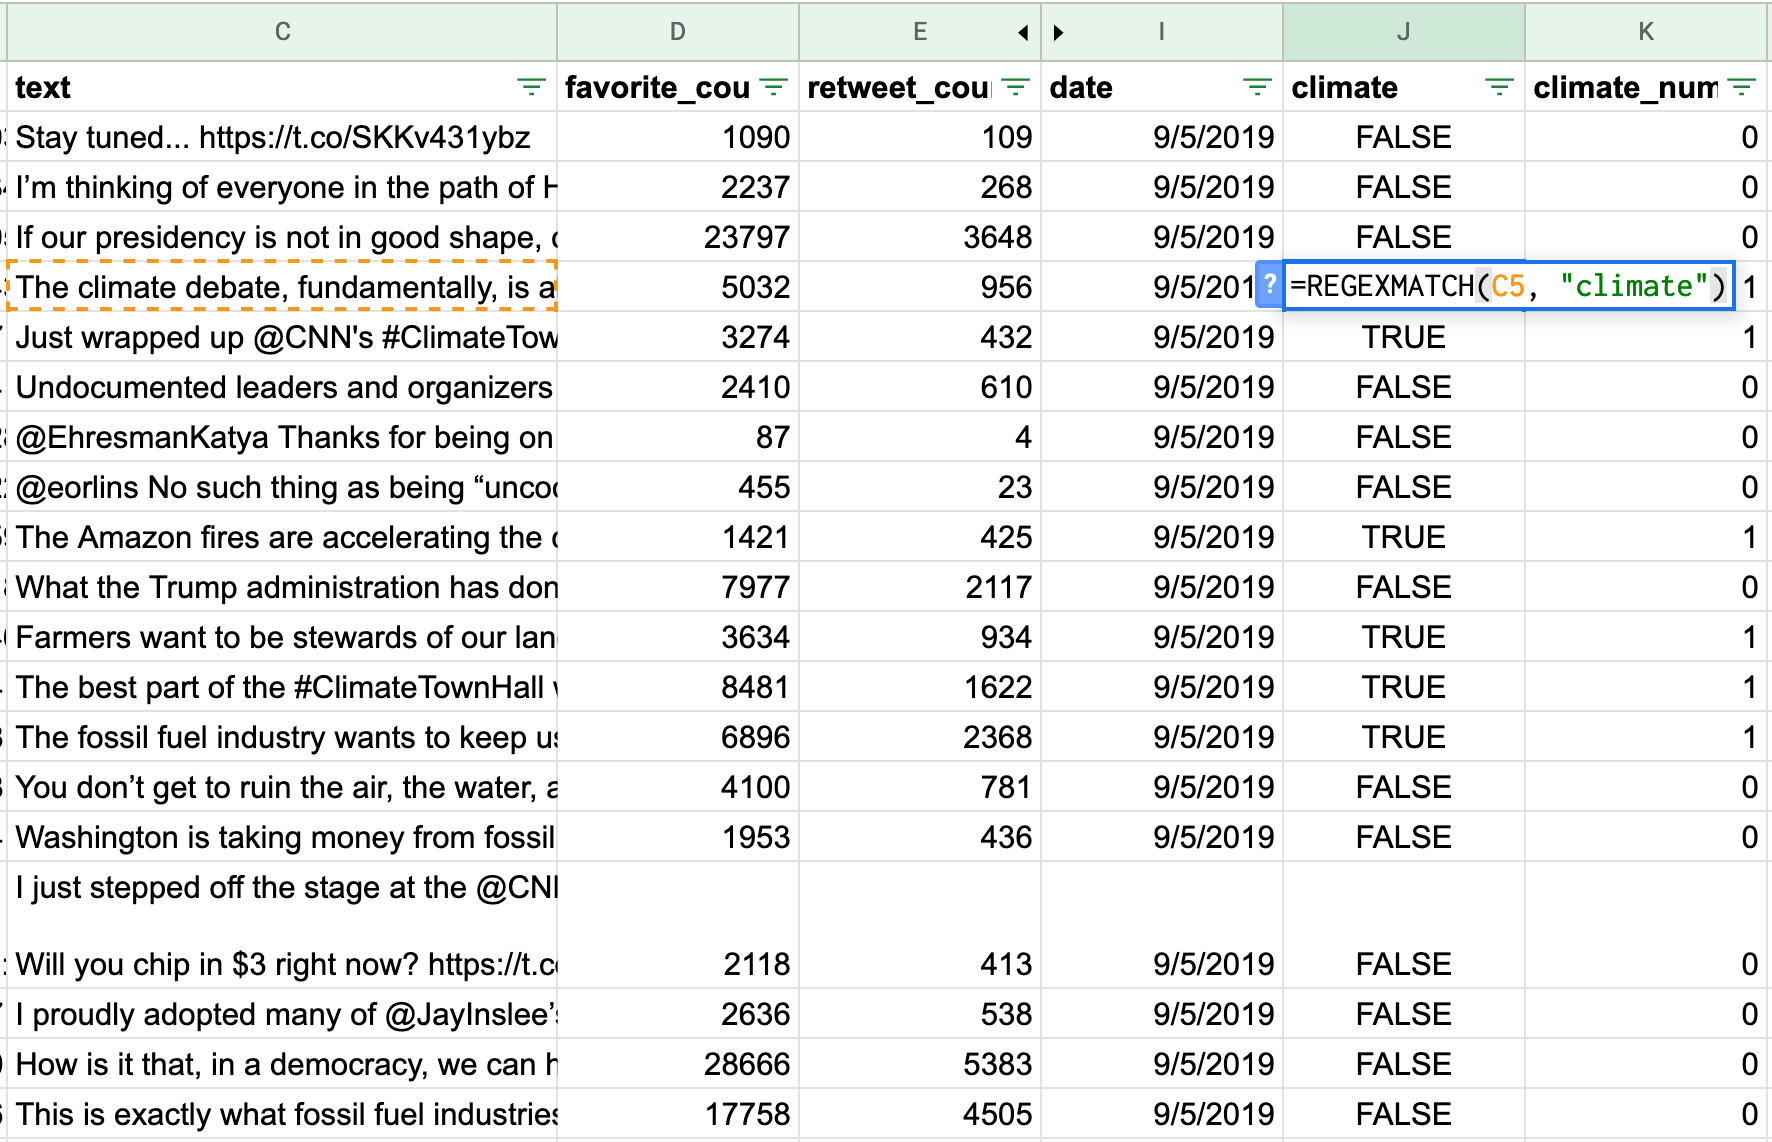
Once that’s double-clicked, the formula will copy to the entire J column and search every cell in column C for the word “climate.” The first instance of a “TRUE” is in row 5 for us with Pete Buttigieg’s tweet about the climate debate.
Counting the TRUEs and the FALSEs
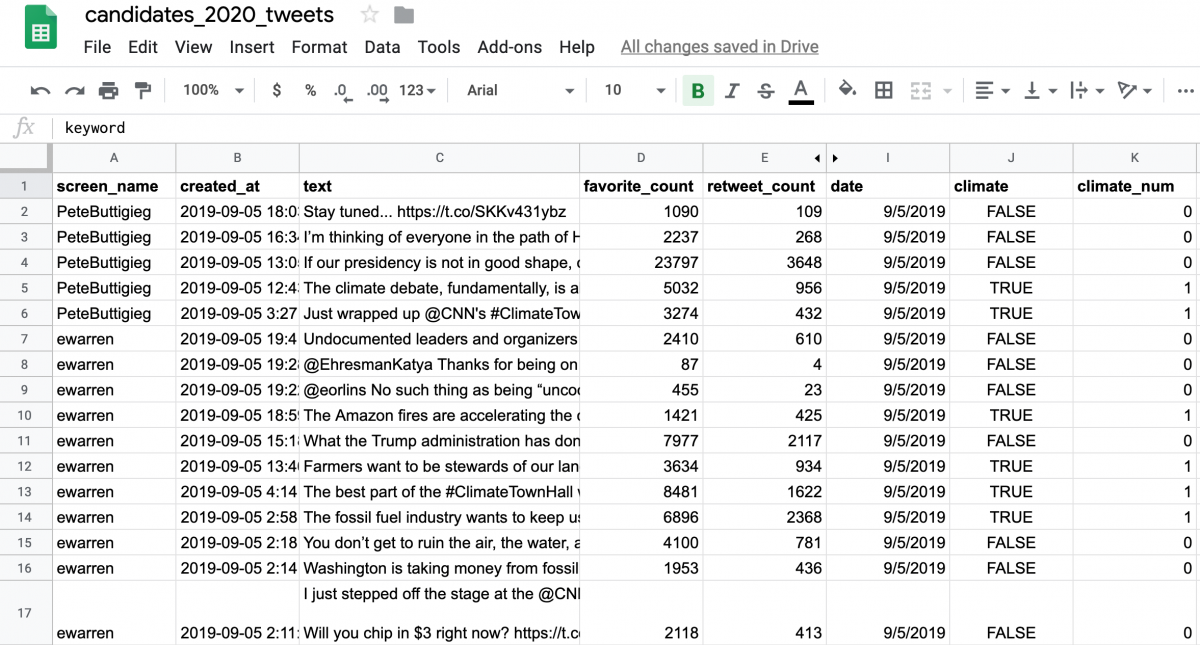
Next, we’ll add a column, which I’ll call “climate_num,” that adds a 1 if the tweet contains the word “climate” and a 0 if it doesn’t. We achieve this with the =COUNTIF(J2, “TRUE”) formula. In other words, this formula places a 1 in the K column if it finds a “TRUE” in the J column.
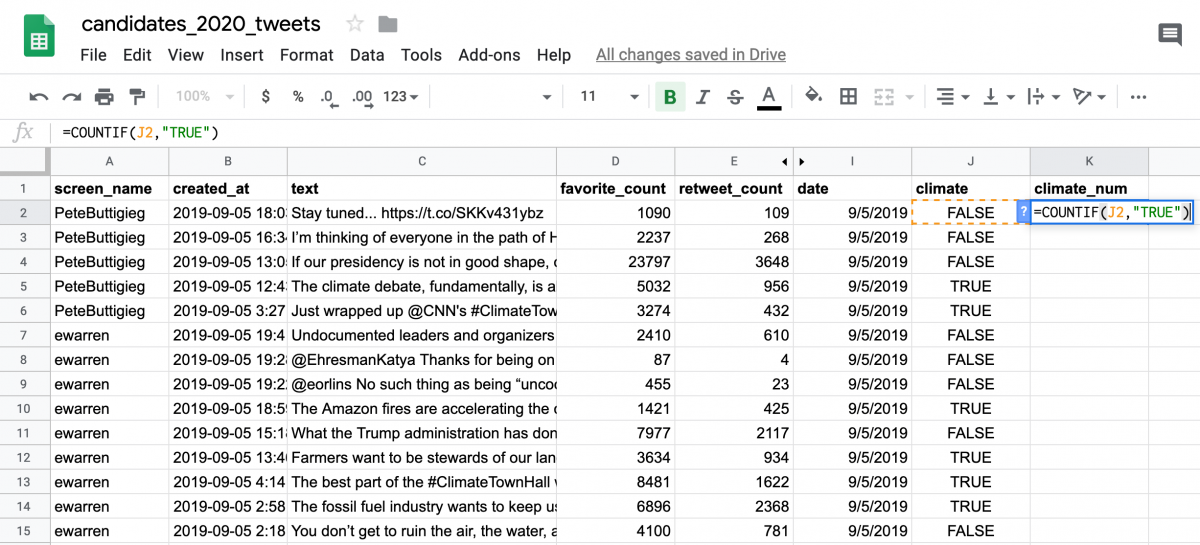
Double-click the bottom-right corner of the K2 cell to apply this formula to the entire column.
Generate a pivot table to count words by candidate
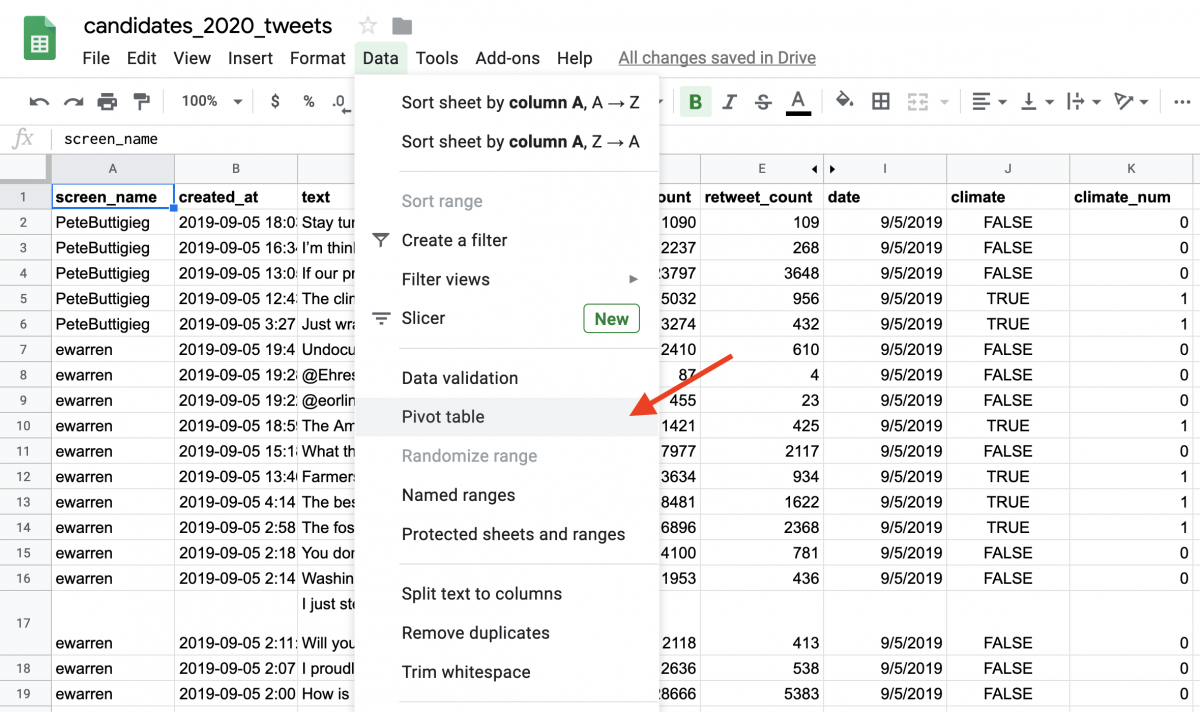
Once we have a bunch of 0s and 1s it’s time to count them by category. In this case, we want to see which of the candidates is mentioning the word “climate” the most on Twitter within the timeframe of our tweets.
To create a pivot table, go to Data –> Pivot table. Create it in a new sheet.
Next, you’ll see the following:
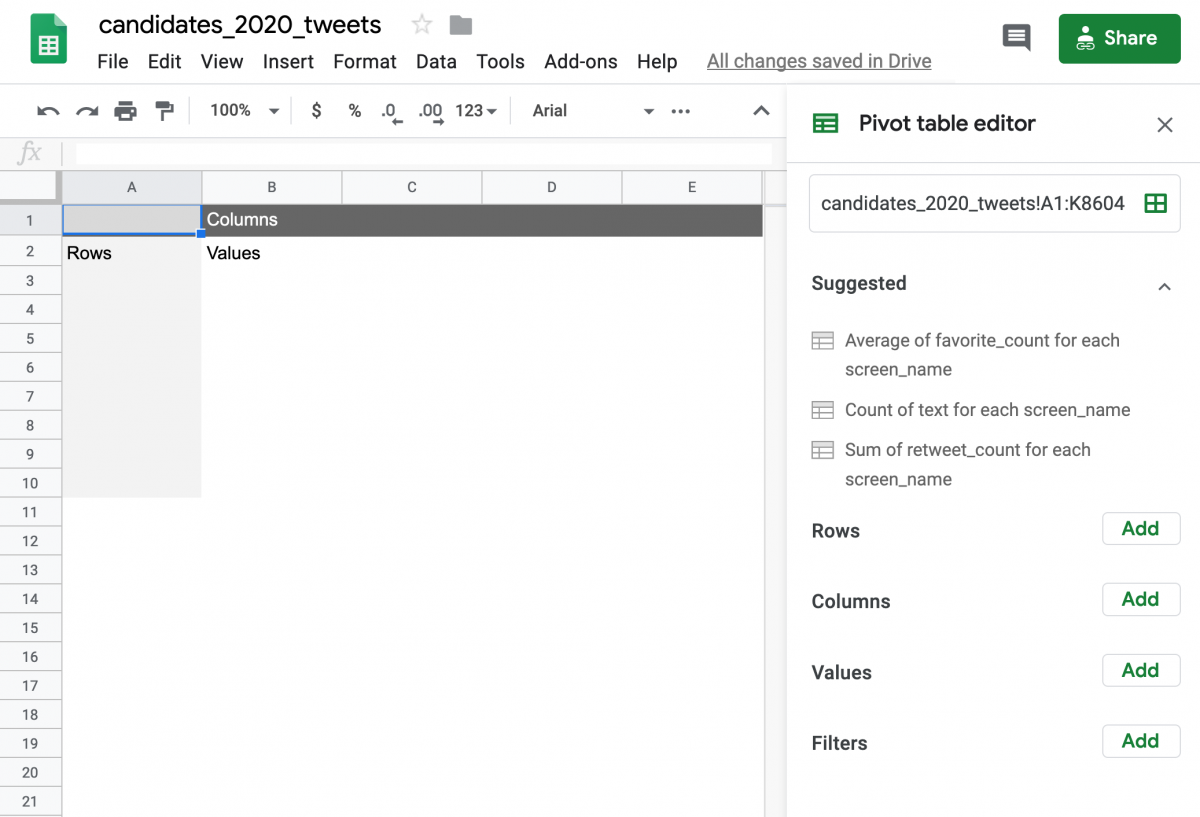
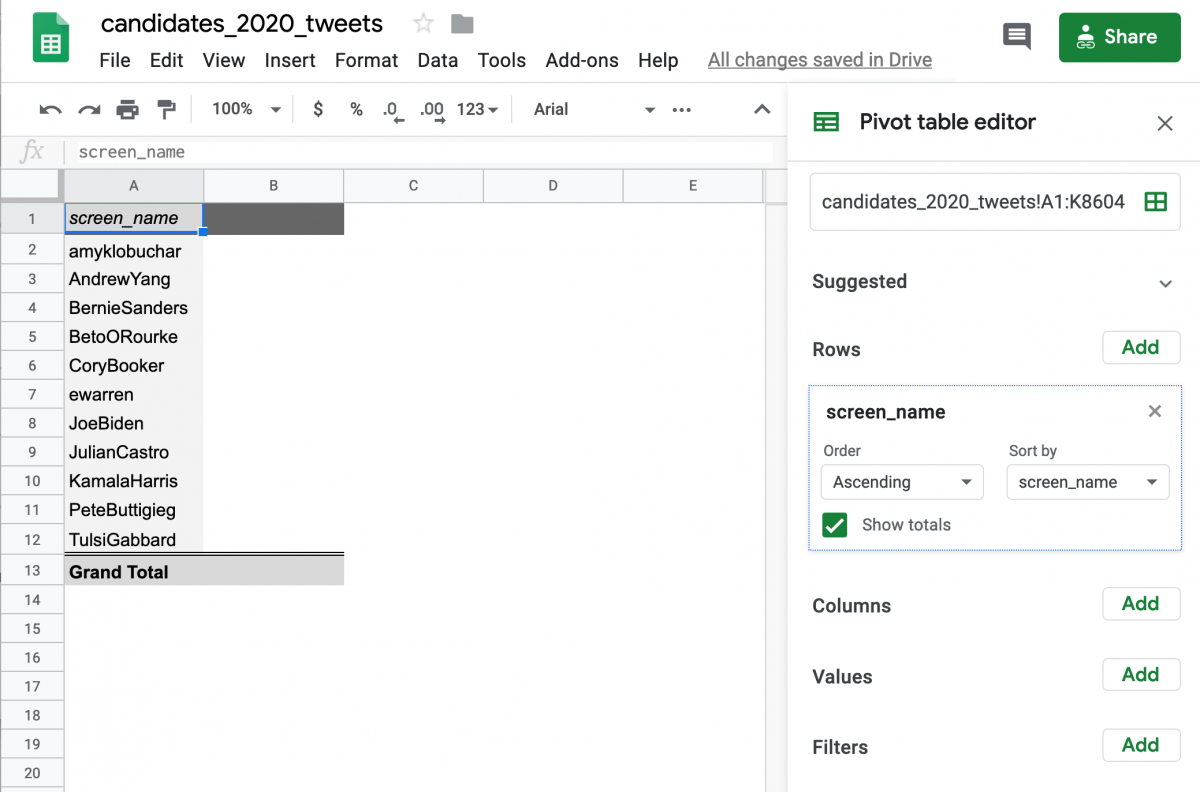
Click the “Add” button next to Rows and click screen_name – or whichever category you wish to summarize your keyword counts by. You’ll see your pivot table take shape:
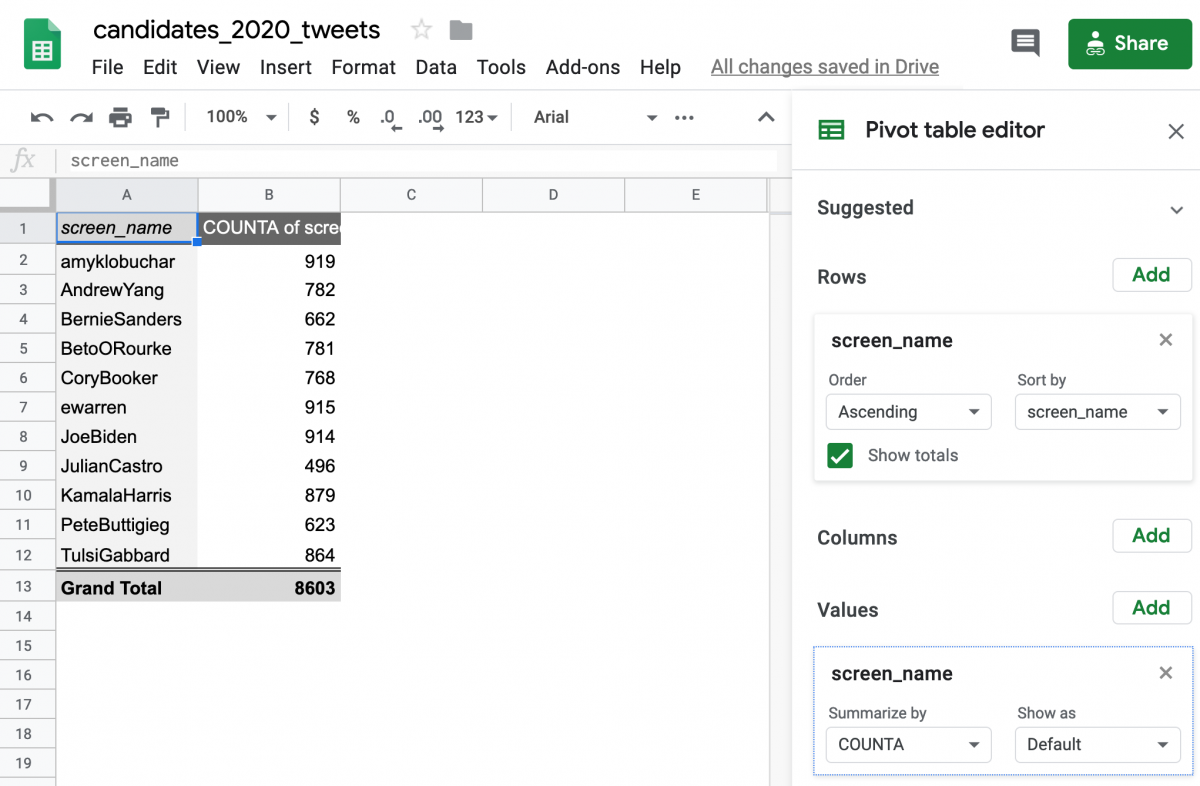
Next, click the “Add” button next to Values. Select user_name again but notice that this time it counts up the number of tweets per candidate.
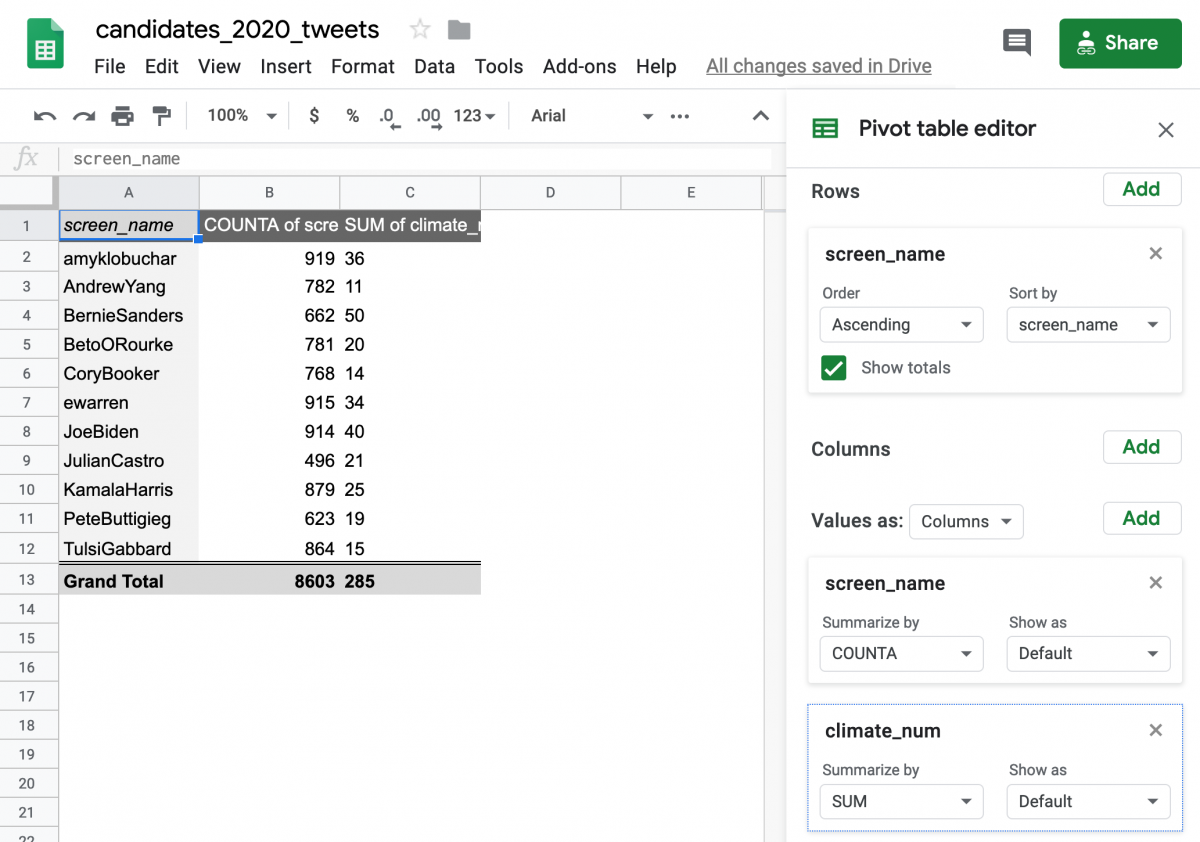
Next, let’s bring in the keyword counts. Click the “Add” button next to Values again and then click climate_num. As long as the values are “Summarized by… SUM,” this will add up all the 1’s in the climate_num column. In other words, adding up the number of times each candidate has mentioned the word “climate” in this dataset.
Raw frequency versus proportion of tweets
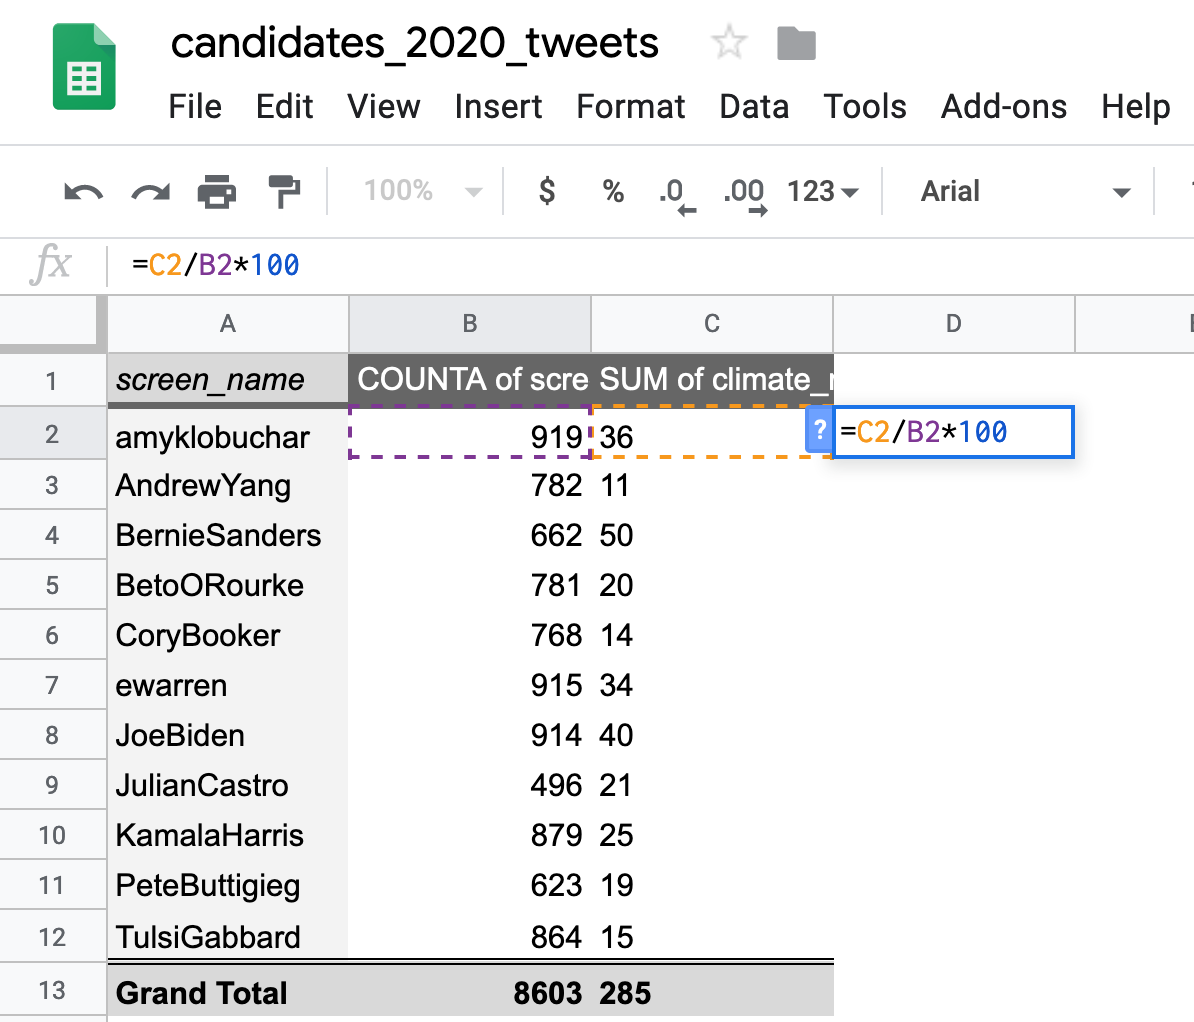
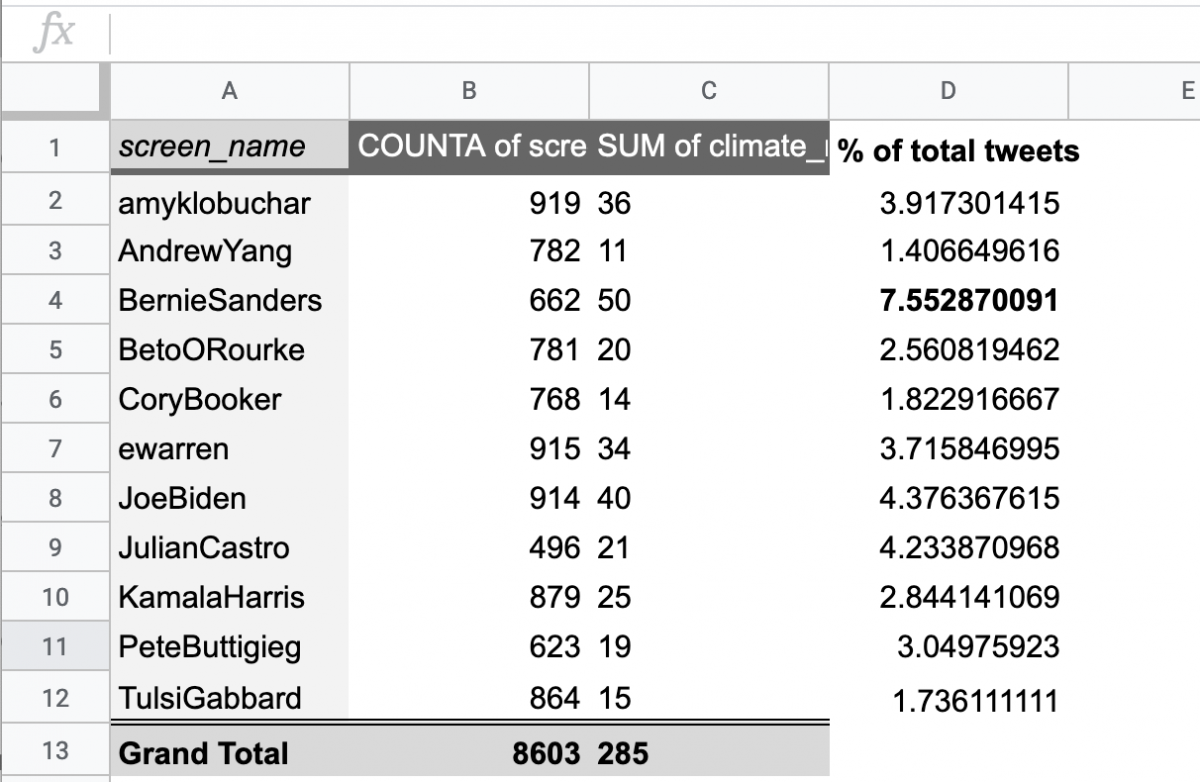
While Bernie Sanders has mentioned the word “climate” the most times, we want to get a ratio to make sure he’s actually said it the most as a percentage of his total tweets. We can use =C2/B2*100 to give us the percentage of each candidates’ tweets mentioning the keyword.
Double-click the bottom-right corner of that cell and apply it to all candidates. Indeed Bernie Sanders has mentioned climate the most times compared to other candidates – at least in this dataset. Put another way, he mentions “climate” in roughly 7 of every 100 tweets.
Thanks!


Terrific quick entry DPH! Thanks for sharing!