Understanding what makes a visualization memorable
John Wihbey teaches data journalism in the Media Innovation program at Northeastern University’s School of Journalism.
The world of data visualization has long been shaped by canonical ideas from theorists like Edward Tufte. His book The Visual Display of Quantitative Information is a must-read for information designers, which include newsroom graphics editors. Tufte’s organizing principles–the eloquent and ethical display of substance, statistics, and design–are now being refined and adapted for media production by contemporary dataviz gurus like Alberto Cairo.
But how does human cognition fit into the practice of visualization? Could data visualization design and the way it is consumed be dissected through intensive empirical research? Could, for example, eye-tracking technology and lab experiments be used to grasp the fundamental patterns of audience perception and data comprehension?
That’s what my colleague Michelle Borkin, an assistant professor in computer science at Northeastern University, is studying. The idea is to take some of the guesswork out of presenting data and to test time-honored theories – like Tufte’s – by deploying cognitive and behavioral science.
Borkin’s latest study, “Beyond Memorability: Visualization Recognition and Recall,” builds on her earlier graduate work, published in 2013, that sought to establish the qualities that make a visualization memorable. Her latest paper will appear in the IEEE journal Transactions on Visualization and Computer Graphics.
Borkin and I chatted recently about her findings and their implications for those doing visual communication of any kind. Among her key findings are:
- Visualizations that are memorable “at-a-glance” are often the most memorable even after longer viewings — i.e., there is something instant, enduring and intrinsically powerful about memorable graphics
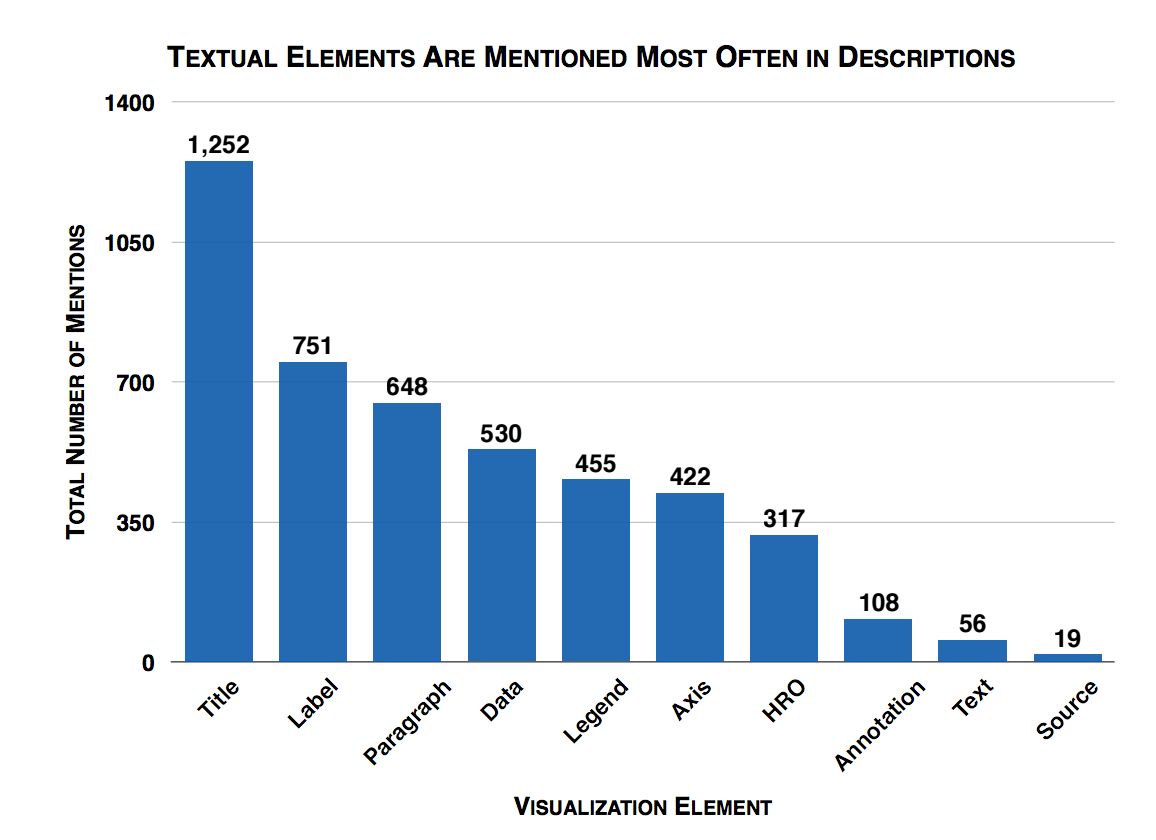
- Titles and text are key elements in a visualization and help recall the message
- Human recognizable objects (e.g. pictograms) help with the recognition or recall of a visualization
- Redundancy helps with visualization recall and understanding
What did your experiment look like, and what did you test?
The underlying motivation for this was to answer the question, “What makes a visualization effective?” We spent a long time trying to think through and design an experiment, and what we ended up doing was putting an interdisciplinary team together of data visualization experts, and experts in cognitive science and psychology, to measure basic visual tasks and cognitive tasks that would give us insight into effective design.
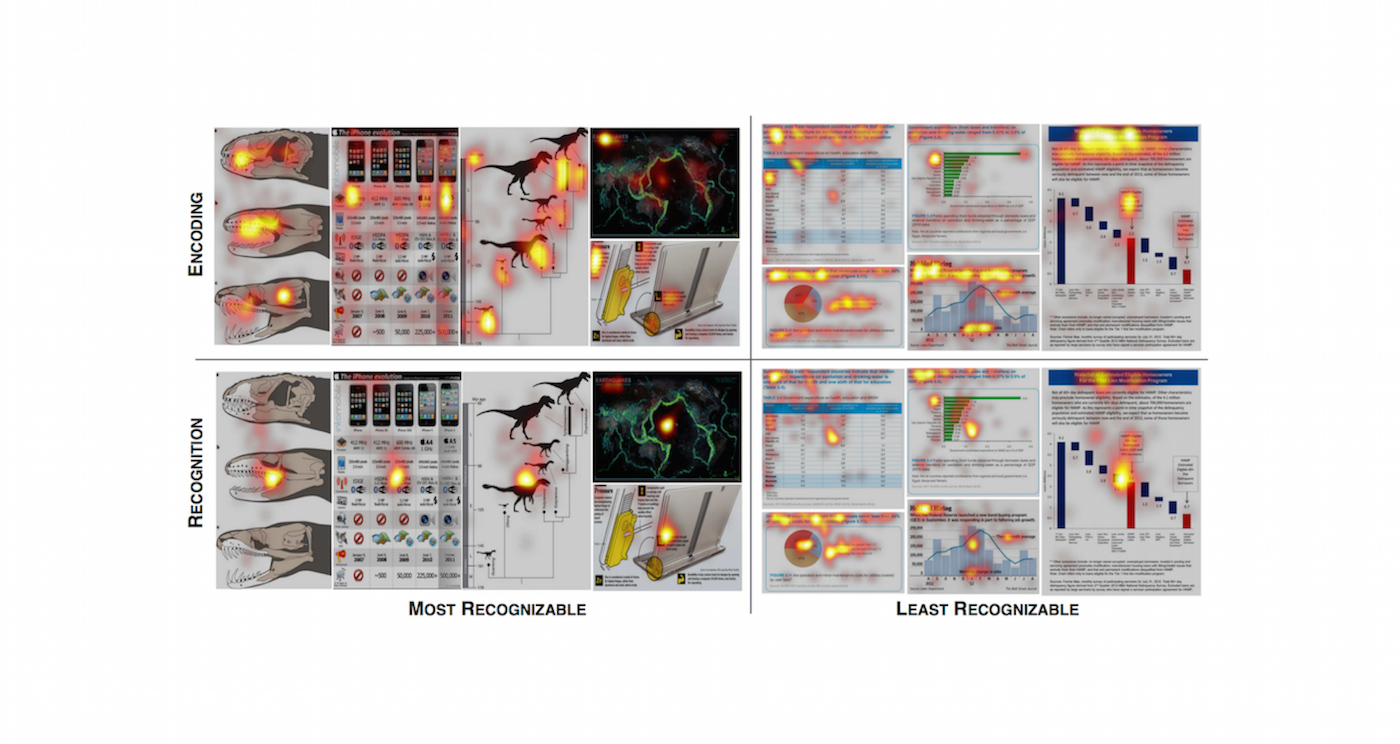
Let me break that down a little bit. We were looking at how people look at a graph – what pieces of information are they focusing on and putting in their memory, and then how they recall that information. When you ask them later on, “Describe the visualization in as much detail as possible” we had people tell us in writing what it was that they remembered. And then we were able with that information, and with eye-tracking data in the lab – so we could literally see where people were looking – we were able to start reconstructing how people in their minds encode visualizations, and then what are the most salient, important pieces that help them understand the main message.
Can you describe the particular dataset?
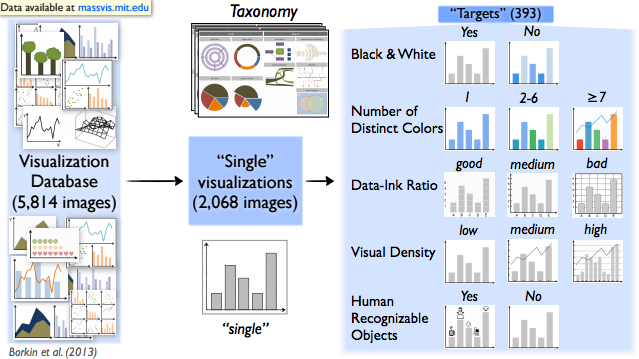
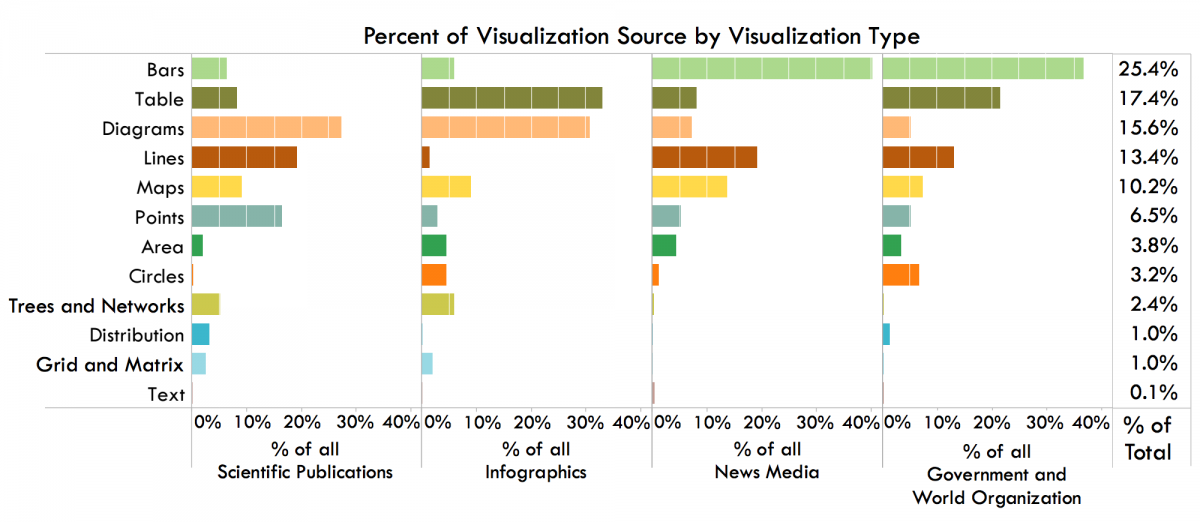
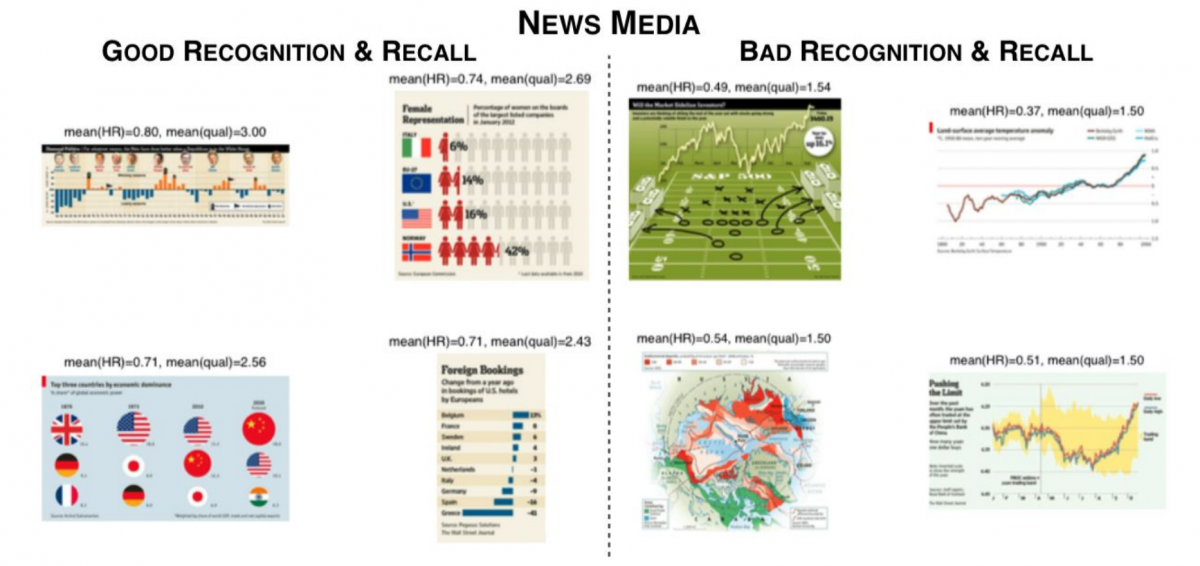
The database we were using is officially called the Massachusetts Massive Visualization Database. It’s a collection of thousands of visualizations scraped from the Internet. It includes visualizations from news media websites, scientific journals, government reports and infographic blog sites. These were visualizations that were “real world.” We added all sorts of extra annotations to them: We marked up by hand where every element of the visualization is located, the title, the plot, the caption, and the axis labels for example. We also marked other qualitative values such as how many colors are included, and we transcribed all of the titles. So we were working with a very rich database. When we presented the visualization, and we knew where they were looking, we knew exactly what they were looking at.
What are some of the instructive, best-practice principles and takeaways from your work?
One of the big ones is that [inlinetweet prefix=”” tweeter=”” suffix=”says @michelle_borkin”]titles and text are key elements and very important in a visualization[/inlinetweet]. Those help people remember the visualization as well as understand it. We saw in our experiment that for visualizations that had effective titles and text annotations, people remembered them more accurately and efficiently, and they got the main point of what the visualization was trying to explain.
You had some somewhat surprising results around pictograms, right?
This has been a hot topic within the research community. What we saw is that pictograms and what we call “human-recognizable” objects such as icons, photographs and logos didn’t distract people. If they are looking at the visualization, they kept moving and looking at the text and data instead. That makes sense. Your brain is made to easily recognize these kind of images. They didn’t dwell on these images.
[inlinetweet prefix=”” tweeter=”” suffix=”says @michelle_borkin”]We also saw that visualizations that had pictograms were easier to remember[/inlinetweet], and it did not hurt the recall, even if it had these pictures around the edges or incorporated. One caveat worth noting: We saw many great examples where the pictograms were incorporated into the visualization and that really helped people really understand what was going on and remember it. But there were also other cases where it was not effectively designed, and the pictures did not relate to what the visualization was and were not helping to encode the data. And that hindered people’s ability to understand what was going on.
How long did people look at the images in the context of the experiment?
In our previous paper in 2013 we focused on “at-a-glance” memorability – the person who is flipping through the pages of a magazine, or scrolling through a web page. We showed there that visualizations can become quite memorable in a short period of time, just one second. Here in this new study, we gave them 10 seconds. That really let them read the text, read the titles, really be informed. But what was fascinating is that the visualizations that were most memorable in our 10-second study were essentially the same as in our 1-second study. One of the interesting takeaways is that if you design a visualization that sticks in your brain after one second, even after viewing it for a longer time, that’s the kind of visualization that will still be the most memorable.
One important caveat, however, is that visualizations that are the most memorable after 10 seconds doesn’t necessarily mean they are the most effective. That’s an important distinction and part of our experimental design, where we measured recall and had people write descriptions. We saw there was a subset, a select group, of the most memorable ones that also contained these design principles of having pictures or text that help enforce the main point of the visualization, and having really good titles and text descriptions, that was probably the most effective.
One thing that struck me is that you find that message redundancy and data redundancy is effective. It seems that the principles of lean design and efficiency in data presentation – here I’m thinking of Tufte, who says that if you have to explain things too much, your underlying design is flawed – cut against ideas of simplicity and clean presentation. How do we balance these competing ideas of redundancy and simplicity?
What’s interesting is that in Tufte’s first book, The Visual Display of Quantitative Information, he does promote simplicity and cleanliness and a high “data-ink ratio” – he says you want as much of the graphic as possible to relate to the data – but he also does talk about how text annotation can help encode data and get the message across.
We empirically prove these conventional design guidelines, but we also explain what the concept is that backs the guidelines. I think a lot of what we show in the study actually does go in line with what Tufte says, but there is, as you mention, a balance. If there are too many elements, people will get confused; if there is too much clutter and pictograms that don’t relate to the visualization, people take longer and that’s not effective design. If there’s tons of text or super-super long titles, then you over-shoot the sweet spot and people take too long to visually explore. So there is a balance. It depends on the context. Tufte and Jean-luc Doumont and others would say that having a little extra something to help get the point across is OK.
When shown a given graphic, what does the eye actually do? What does the heat map typically look like? In the past, you and I have discussed the research on reading web pages – the eye-tracking data often suggests an “F”-shaped pattern. But what about for graphics?
There is a lot of variation in the path the eye takes based on the design of the visualization. But fundamentally what happens when a picture comes up on the screen, you look at the center, but then people start gravitating and looking at elements. After the main plot, they tend to gravitate toward title, toward descriptions or text, and they also tend to gravitate toward annotations. If you mark the most important point or put an arrow on the plot, that really will grab people’s attention to go look at that point in your plot. We saw some interesting effects when things were not laid out in an easy-to-read and meaningful way, people started to wander around more and look for specific pieces of information.
We all know that we people have different learning styles. Is it possible that there is an actual “average graphics consumer”?
We designed this and kept it simple enough, with short exposures and simple and general, easy-to-read visualizations, in the hopes that individual differences wouldn’t come into play. But you hit on an important point for future research. We need to look into different populations, different areas of expertise, and different publication venues more specifically to look at if there are differences between groups of people and how they look at these things.
What are your favorite kind of visualizations? What do you like to consume?
I’m a huge fan of The New York Times graphics group. Their stuff is absolutely gorgeous. They pay very close attention to making things easy to read, and clear and simple, as well as communicating messages very clearly.
What are the things that you despise the most in visualizations – what’s just yucky for you, as a computer scientist who studies these technical dynamics for a living?
That’s a tough one! I would say this is a very personal pet peeve: Visualizations that are overly congested and don’t clearly state the message, be it visually stating it or semantically stating it, through text. Certainly working on this project, I would say that’s become an increasingly larger pet peeve. Similarly, also working on this project, I’d also say that visualizations that throw pictures on for no good reason and don’t relate to the graphic – pictures that are just there to get you to look at, but have nothing to do with the data or message – those have become a pet peeve of mine that I see out in the real world.