From Chaos to Clarity — On Finding a Foothold in the Ever-Shifting Visual Storytelling World
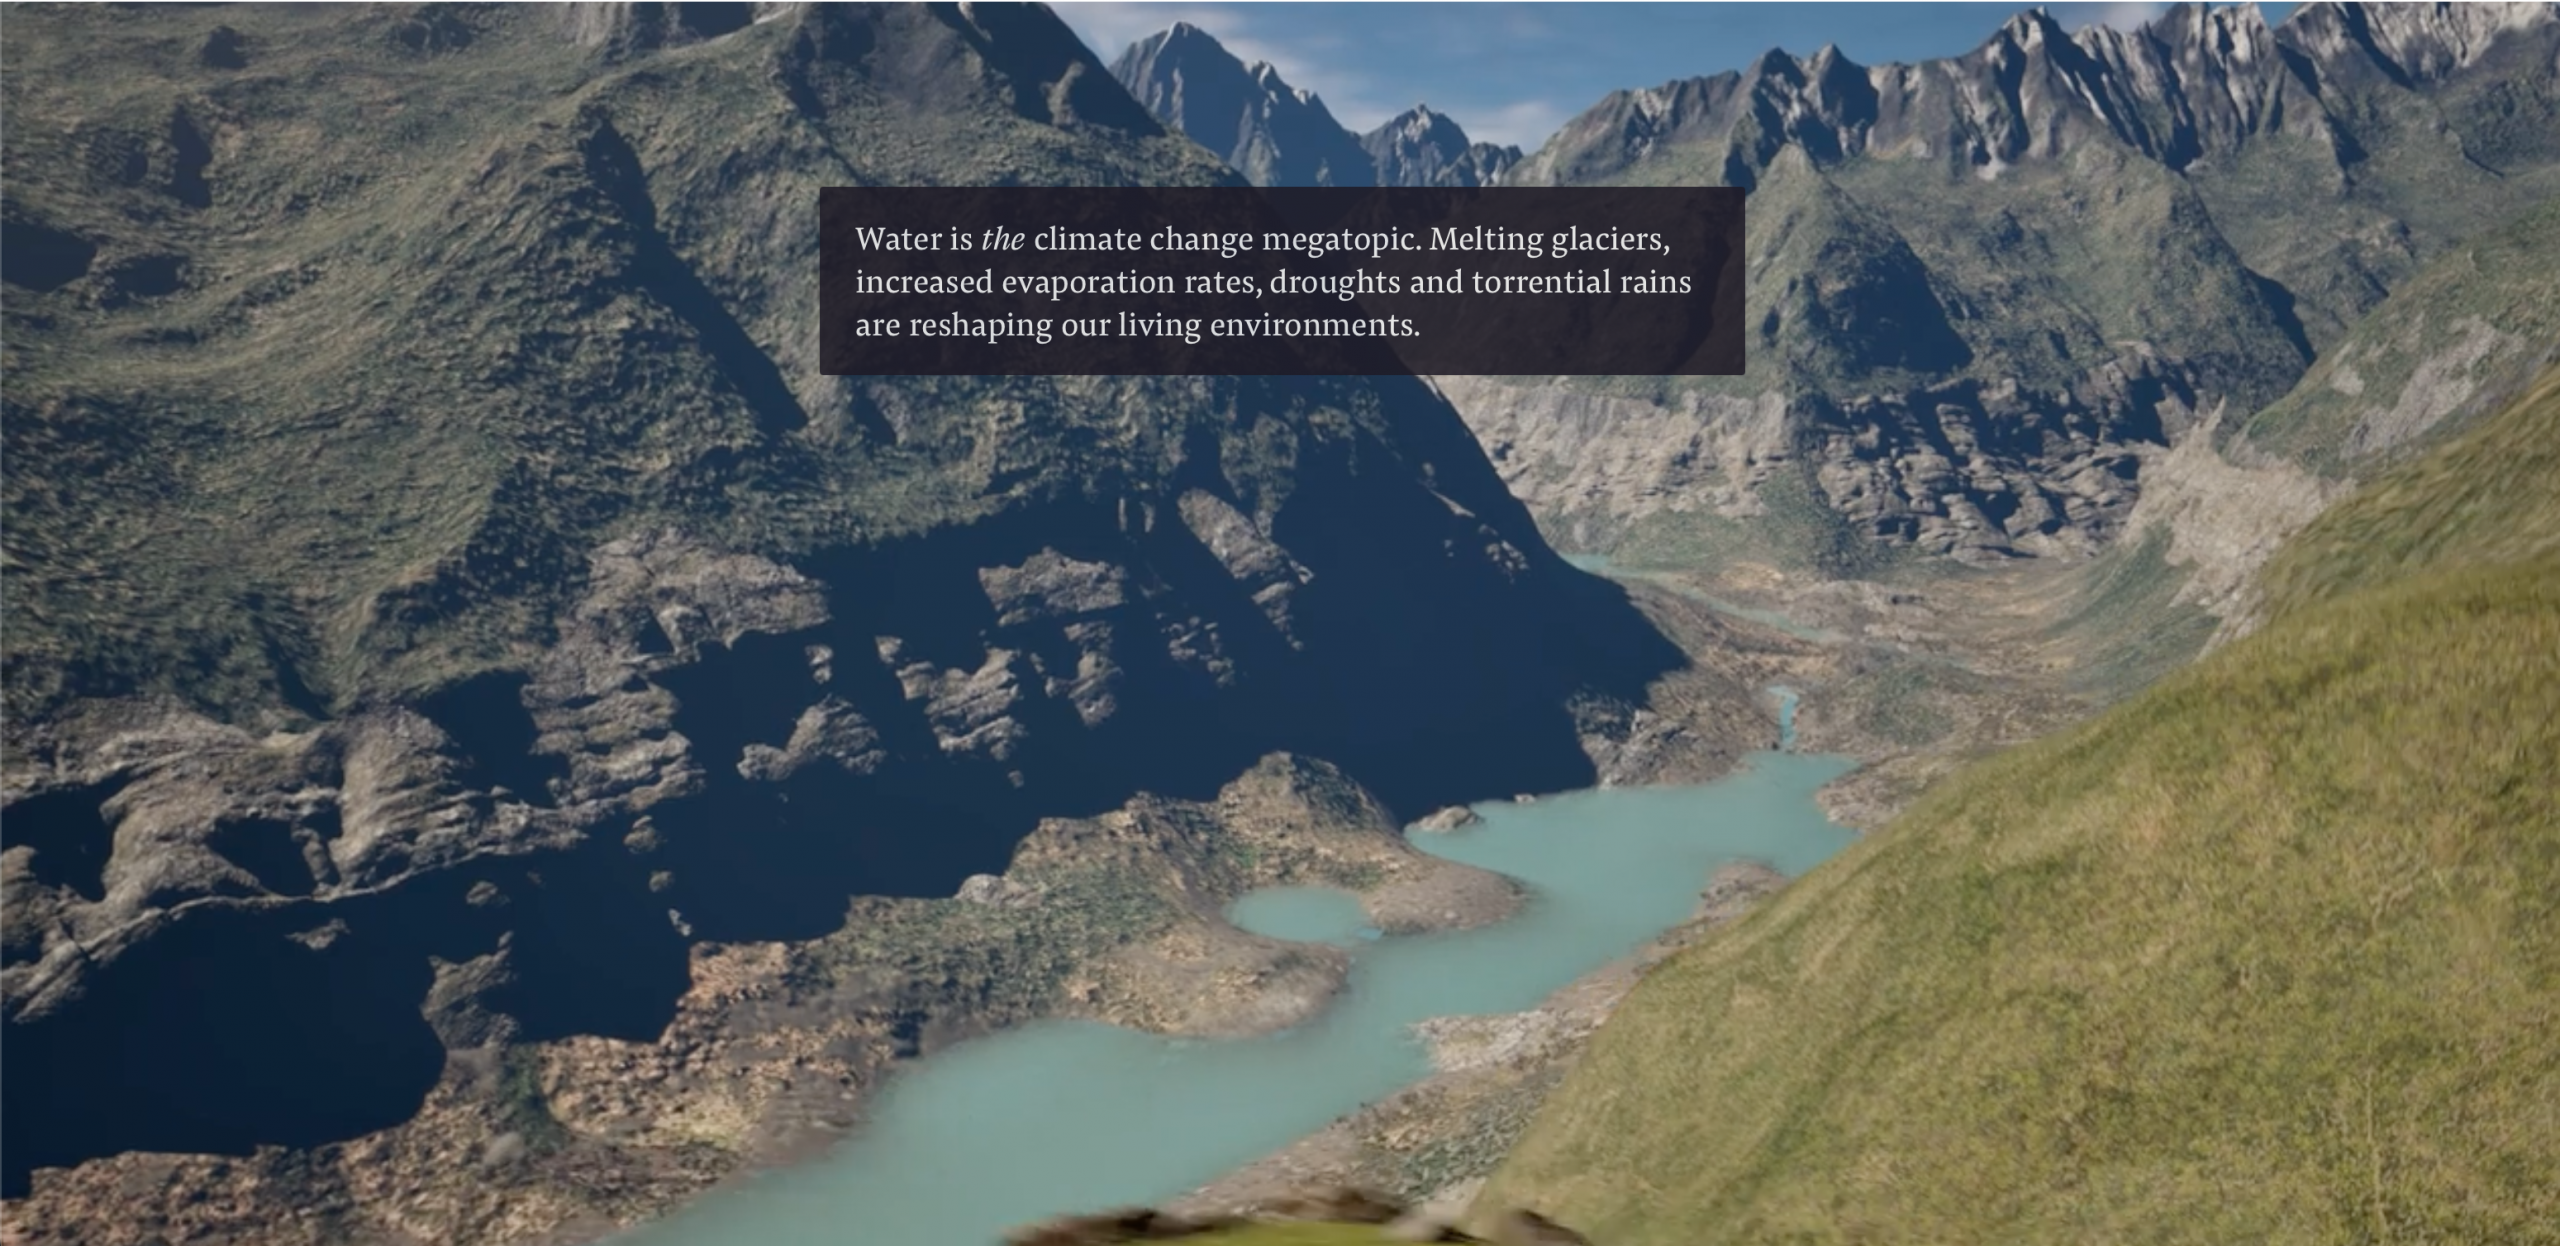
As a Visual Editor at the Swiss daily NZZ (Neue Zürcher Zeitung), Adina Renner is responsible for stunning projects like “Switzerland in 2075,” a visualization of the impact of climate change. That kind of work is built by many people with specialties that cross disciplines. Storybench spoke with Renner about newsroom dynamics and the different roles in multifaceted teams.
When you first joined the newsroom after college, how did you navigate working in cross-functional teams?
When I joined, I learned it’s unusual to have project management here [at NZZ]. It’s part of Swiss culture — we don’t have a very hierarchical organization. It’s nice, but it was always unclear who was the lead of the story, unless explicitly discussed. If not, the default is that the person who brings the story, idea and research is the lead.
A cross-functional team usually has someone who does the data research, someone who does the design, and someone who develops, to name a few. I still work on stories where I create maps and sometimes data visualizations. If another person suggests a map, I’ll do the research for it and we’ll communicate how and where it fits in the news piece.
Sometimes when I only do the visuals, I also research the data and deliver those maps. Journalism is really about time management— publishing at the right moment and knowing how long things take. That’s where I started developing myself in this direction.
In a cross-functional team, how do you define your position title?
Like with the formats, our roles will always change. I call myself a visual story editor and I am still at the beginner level with managing the spaces here.
Roles and titles are different for every organization. In journalism, you need structure: you need a timeline and deadlines. But journalists just want to write or design and do their job. They don’t want to go into a complicated tool to figure out what they have to do. This’s how I understand my role: it’s my responsibility to meet them where they are. I communicate the deadlines and tasks. That was one of the biggest lessons I learned.
Planning for Stories and Resources
How do you plan for your stories? Is the collaboration process different for short- and and long-term stories?
Having a good balance between collaborative work — where everybody is together in one room, brainstorming and trying to grasp the story. This is really important in the beginning, because it’s really difficult to make up for a bad start.
Ideas are always at the center of the process. As you move into the production phase you communicate this with the individual contributors. It is also important to think about the newsworthiness: Is this of interest to our readers right now? Does it add to the ongoing conversation?
And then from there, there’s two different approaches.
First method: When I am leading a team I will develop a vision for the project. I do some preliminary research on the material and think of someone on the team who has specific skills or has worked on something similar. Very often I have something that we’ve done together, but then I realize, if we work on this together we can develop the story in a particular way.
Second method: It’s also the case that there could be multiple people who can work on it. If I don’t need someone with a specific skill, I will post it on our site, on our Slack channels and it’s kind of an open call.
And as for long- versus short-term stories, I think for me, the difference is mainly size. Short-term stories mean you just go for it with whoever is around. With long-term stories, the team can quickly grow to five, six, or seven people.
Does the scope of your story change if the resources and people you want to collaborate with are not available?
I think stories can be told in many different ways. It will be a slightly different story, sure, but there’s always another way to tell it that’s less technical. It’s powerful enough in itself to have that simple switch. Sometimes I like those restrictions because they make me think: What is the minimum I need to communicate for the story to be clear?
Would you say that if your narrative is powerful enough, then all of these fancy technologies and resources aren’t necessary?
I wouldn’t go that far. With an ideal story, the technology fits perfectly with what you’re trying to say and how you want to communicate it. The key is to shape the story first, then choose the format and methods that best support it, rather than letting the tools dictate the narrative.
How do you decide which format to use for stories?
In traditional journalism, you have defined formats—the article, the image, the portrait. In visual journalism, we’re still in the process of defining new ones.
For example, we’ve defined a reconstruction: you look back and use visual elements to reconstruct/ recreate an event. Then there’s inquiry, where you have a more open question. With this corridor I mentioned, we were observing what was happening and then making it experiential for the reader. Another is verification, where we can say: this is true, this is false and this is what we don’t know. It’s about bringing order to different statements or trying to verify or falsify a statement. We also use data analysis—when you have an interesting dataset, you explore what the numbers reveal and build a story around that.
For example, when we have an idea (call it news events) and the sources you have, we begin with a question. From that question, we define what material we want to use and then we do our research. From there we understand how we have to communicate this research and, finally, the format unfolds from the resources we have to present the information. We’re starting to categorize our stories at the beginning of the process by the question that drives them. That’s just my approach—everyone’s process is very different.
How big a role does your audience play in producing a story?
When developing a story, we always ask: “What is the story? Why now? Why tell it this way?” These questions consistently bring us back to what’s relevant for our audience. My boss uses a good visualization for this. [It shows that] as more time passes, the exclusivity — or distinctiveness — of your story should increase.
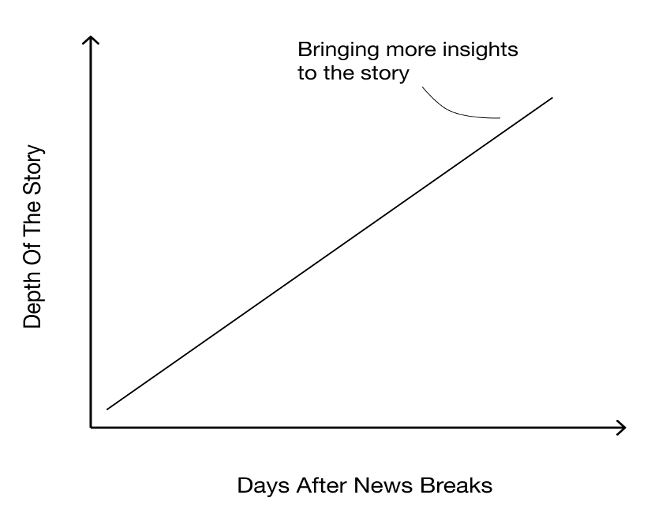
But you have to bring new insights. People will already know quite a lot, so the goal is to give them a reason to re-enter the discussion.
Technology, Tools and Advice
What tools do you recommend people should familiarize themselves with for data and visual journalism?
In general, focus on the storytelling. In the sense that consuming media like podcasts and movies, helps you dive into the world of journalism because at its core everything is about the story.
On the technology side, people look for 3D moments and then ability to read code. For data visualization, we use DataWrapper, D3 (though not required in many newsrooms anymore, but still an asset if you know how to use it.) Since we publish across platforms, it’s important to produce work that translates well to a multimedia experience. As for geospatial visualizations, QGIS is a great tool for geoinformation systems where you can visualize geo data and analyze it as well.
Finally, collaboration. That’s a hugely important skill. Currently, it’s a cool time for journalists because there are so many different skills, specializations and many opportunities to collaborate.
For someone just starting their career in journalism, what advice would you give about discovering their strengths?
Do everything! Don’t try to specialize too early. I hope I’m not specializing too early myself. I spent a lot of my time trying out different things like film, photography, writing, graphic design, UX, UI, and data visualization. Now I realize, I’m at a moment where all these things come together and it is so fun! Eventually it will all come together at one point and make you a unique contributor to projects.
Another important thing is being aware when you are trying things out and making a mental note of the things you enjoy and try to go in that direction. When I was experimenting, I loved (and still do) Federica Fragapane’s work and wanted to be that person who does those kinds of data visualizations. But then I realized that I actually don’t like to sit for a very long in one place and just work on these visualizations. It’s not something for me. When I’m doing it, it is so fun. But making concepts for visual stories, building the storyline — I absolutely love to do that and I could always do that.


