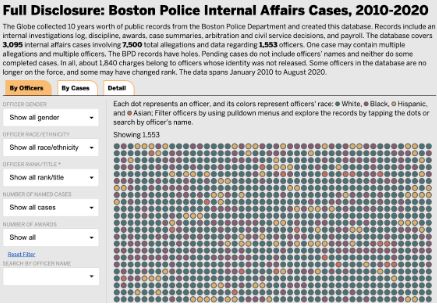
Boston lacked a system for the public to keep tabs on police, so the Boston Globe built a public database
The killing of unarmed people of color at the hands of the police led to protests and calls for change last summer. As popular support for the Black Lives Matter movement grew, so too came increased scrutiny of members of law enforcement and calls for them to be held accountable for their actions. Seeing this, a team at the Boston Globe started looking into internal affairs data from the Boston Police Department, initially seeking to create one story. What they found was more data than could be adequately told in a single article, and information that they thought was important for the public to access. They decided to create a searchable database of disciplinary records, citizen complaints and awards received by officers. The data they collected was analyzed and used to tell other stories, but the information itself is now available to anyone who wants to search.
Andrew Ryan is an investigative reporter for the Globe, who, according to projects editor Brendan McCarthy, did the “heavy lifting” for this project. Ryan’s work as a journalist has been aimed at holding public officials accountable. He spoke with Storybench about the creation of this database and the process of assembling data.
This interview has been edited for length and clarity.
Can you tell me what inspired this story?
The events of last year across the country prompted us to take a more aggressive look at some of our local coverage of the police department. We have a long tradition of aggressive coverage of the police. Obviously, the paper and the media landscape has changed a lot in two decades, so it had been a little while since we had dug deep, particularly looking at how the police police themselves. That started us on our path.
We found that increasingly major police departments are putting forward front-facing dashboards so that people can actually get a sense for complaints and the internal affairs process, and for what officers are receiving these complaints and being disciplined, or not. We found none of that with our Boston Police Department, so in the absence of that, we decided to build our own. That was kind of the jumping-off point. We started off doing a relatively superficial story, and then we realized that there was just so much we didn’t know — that we wanted to really dig deeper to really understand how the system worked and to try to take a comprehensive look at records.
“I think in some of the best journalism, the data is the jumping-off point.”
Can you describe your role in this project and the process of collecting the data?
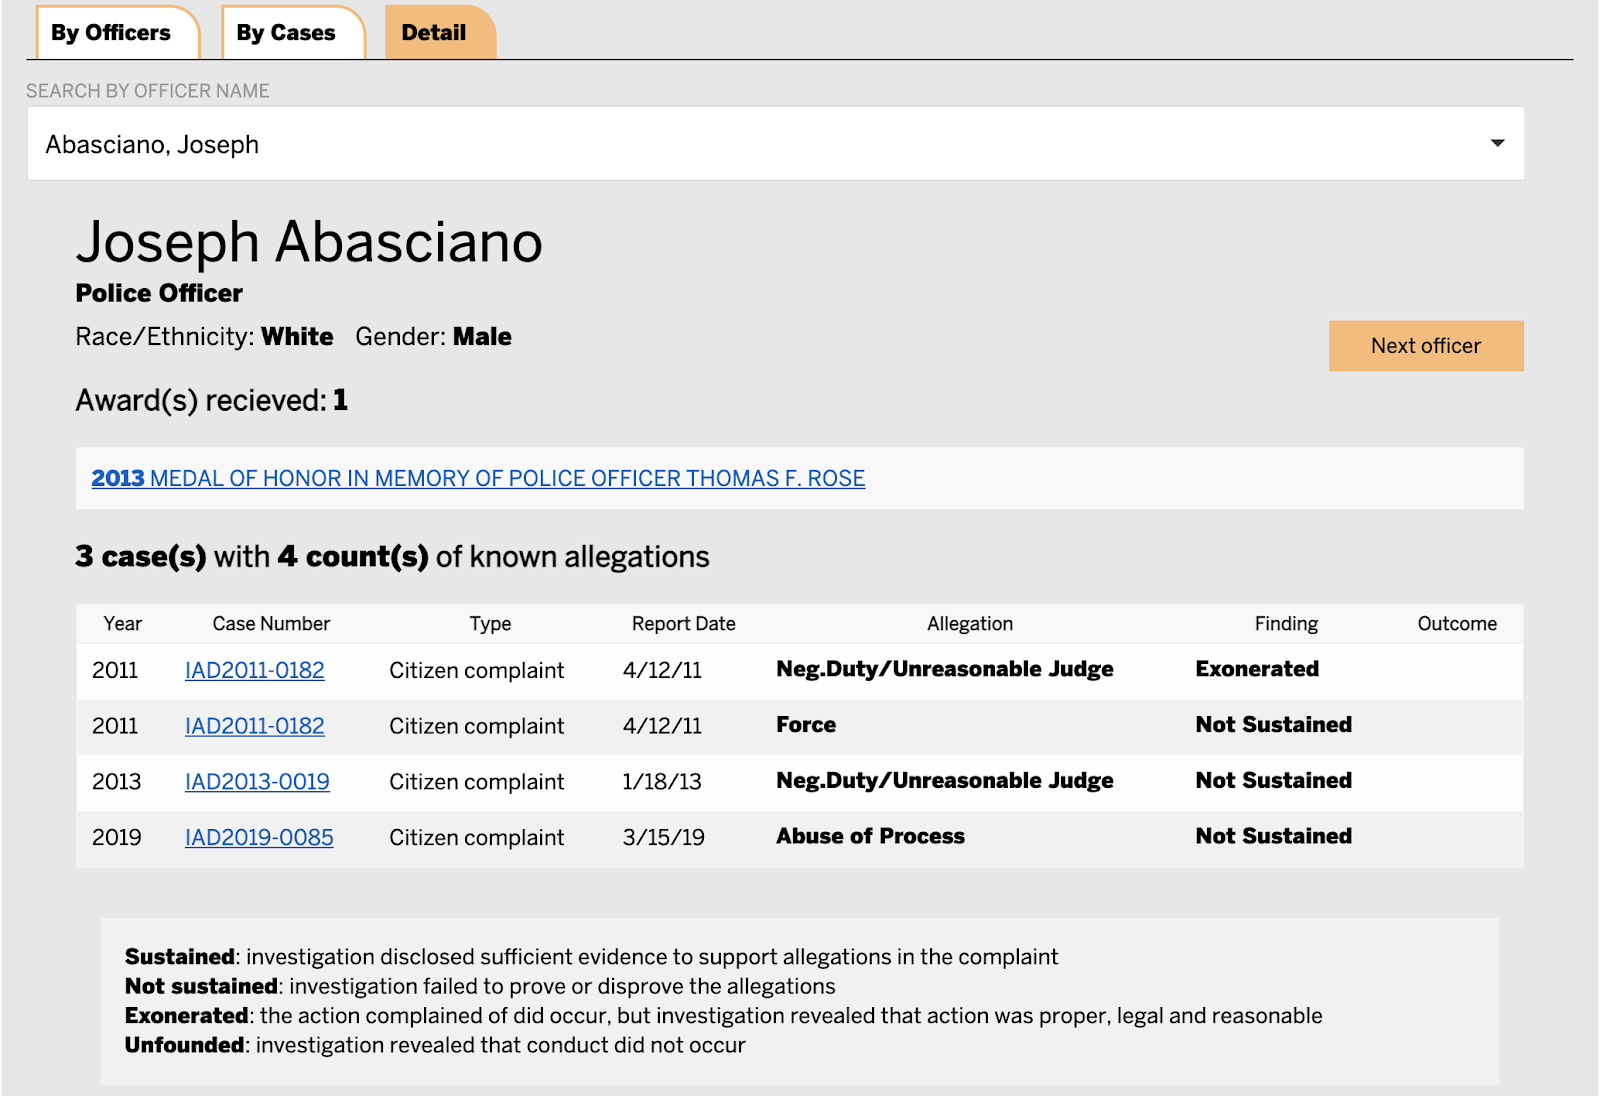
I was working with a small team doing a lot of the records requests, filing them and then lobbying the department to release the data. The first thing we got was paper records. The police department puts out something that are called personnel orders, which are basically like an internal notification system that is publicly posted inside the stations in the department. It has everything from new assignments to promotions to discipline. We had requested an internal affairs log, but that was taking a long time to get to us. And so at the same time we requested all these paper documents. We got a decade’s worth of them, and there were thousands of papers. Working with a colleague, we built our own spreadsheet. We hand-input the data, and that really gave us a sense for the process, because obviously that took time, and we could look and get a sense of certain patterns.
After we had finished that, we ended up getting this internal affairs log, and we could sort of compare and contrast and see where things lined up and where there were gaps. There were certain cases where there wouldn’t be a public notification, and there were cases where we could see disparities. We had also long collected payroll data showing race and ethnicity and gender, so we layered that on top of things. We pulled and looked at civil service records. We requested arbitration decisions – all of these different things that are part of the discipline process or have a bearing on it had never been pulled together into one database before.
It was painstaking pulling all of these different pieces together. The internal affairs log was just a spreadsheet, but then we uploaded all of the personnel orders so we could then link to those to cross-reference. We layered on top the race, ethnicity, and gender data; we added the civil service records–which were PDFs that we uploaded– and the arbitration records. In order to fully understand how the system works you kind of need to look at all the different pieces. It was pretty eye-opening. We learned some things, and people who even thought that they knew this stuff by reporting it learned some things as well.
I thought using data in stories meant that you see the data, analyze it and write your story. How did the decision to make the data itself accessible and searchable happen?
I think in some of the best journalism, the data is the jumping-off point. Often, the data itself isn’t necessarily the story. When you look at the actual stories that we published, we used the data as a guide. We found examples of pretty blatant cover-ups and officers who clearly committed crimes [and] got away with them, and those helped illuminate the data. Data’s important, but it’s the people that make stories riveting. The decision to put out the database as a separate thing was purely what I said before, that there were other departments that were doing versions of this. Chicago has a version of a public-facing dashboard, and so we figured, why not do it ourselves? If we are clamoring for the department to be more transparent, why not gather all of these things and make it public so that people can use it as a resource?
(Photo by Biruitorul, Wikimedia Commons)
What’s something that you’d do differently to make the data collection easier?
One of the tricks you have when you’re layering different data sets on top of one another is having something to identify someone across different sets — like in this case, a unique ID for each officer. There’s a bunch of different IDs that are used for officers, but there is one unique employment ID that’s used by the city for payroll purposes. We never were able to get that out of the department, and instead we had badge numbers and other things like that. Badge numbers can change depending on rank, but that employment ID is a singular ID number that stays with an employee throughout their career. I would’ve loved to have gotten that, because it would’ve just made the layering of data easier. We had to do work-arounds because the department, for whatever reason, wasn’t forthcoming with that. That would’ve made it easy. In shortest terms, that’s probably the simplest. When you’re going to be merging datasets, always think: “What’s going to be my unique ID that’s going to allow me to combine these two things?” That way, when you have two John Smith’s on the same payroll, for example, [then] you know which is which.
Do you have any advice for combining datasets?
[Ask] for data maps before you request the data. This can get problematic because it depends on how sophisticated the person you’re dealing with is, in terms of technology. Still, try and ask for the potential data that you can collect. That way, you have an idea of all of the data at your disposal and can know if there’s a unique ID, and that can help.
[Ultimately, we had to] create our own ID. Within policing, there’s lots of multigenerational families, so we would have fathers and sons with the same name, in particular. We would get our list lined up as close as we could, and then we would have to go to the department and say: “Which one is this? Is this the right person?” I forget how many [names] we ended up having to do that with. It was a reasonably small number, but a unique ID just takes care of all of that for you, so you don’t have to worry about the multigenerational families or even just the common names.
“As the world has become and continues to get more digital, data is going to be everywhere. I think as journalists, we need to keep our eyes open and think of some of those unique, interesting data things that can make things concrete.”
Do you have any thoughts about the future of journalism in regard to digital storytelling and data visualization?
It’s obviously completely changing, especially when we’re combining data visualization with video. We obviously saw a lot of fascinating recreations just with the siege at the Capitol last month. It feels like this stuff is almost changing every six months and getting more sophisticated. I think that as we live in a more digital world, it’s going to open more doors.
As a little bit of an aside, I covered city hall for a long time. Years ago, there was a push for a big pay raise by the City Council. They were saying that they work around the clock, so they deserve this huge raise. That was true for some of the councilors, but for others there was a sense that they didn’t work around the clock. I tried to figure out a way to quantify that. As I was walking into work one day, I was going by the executive garage where the city councilors parked, and I noticed that they used a card key to tap to get into the garage. That means that there’s a record, and there’s data showing exactly when they came in and went out. I was able to get that data after a records request, and then we triangulated it with a bunch of other things like attendance at committee hearings. Stuff like that I think is going to be more and more common, where you can actually have all of this data. In the 1980s and 1990s, that didn’t exist. But as the world has become and continues to get more digital, data is going to be everywhere. I think as journalists, we need to keep our eyes open and think of some of those unique, interesting data things that can make things concrete: For example, showing when people are going in and out of the door.
Boston Globe analysis of BPD records
Is there anything I haven’t asked or anything else you’d like to talk about?
One of the things that we did here that I think was significant was the inclusion of awards. Obviously a lot of this is discipline records, but we also asked for awards, and we rolled that into our database. It wasn’t just that you could search to find every time somebody was accused of doing something wrong, but also every time someone was honored for doing something right.
Obviously, the world is complicated. Policing is a very difficult job. I think that it’s important that we hold people accountable when there’s an abuse of power, when people look the other way, or when discipline isn’t implemented. At the same time, we also need to remember that people risk their lives and that it’s important to honor when people do something right.


