How to build an interactive county-level map in Tableau
Last year, to explore the impact the opioids crisis is having on the United States, The New York Times visualized overdose deaths by county. Storybench published a tutorial for creating the map in Carto.com. The following tutorial shows you how to create the same map using Tableau Public.
Download the drug overdose data
The New York Times based its map off of 1999 to 2014 drug poisoning deaths data from the National Center for Health Statistics. Download the CSV Format county estimates file here. (The filename should end in by_County__United_States.csv.)
Open the CSV file using Excel or similar spreadsheet software. It contains more than 50,000 rows. Notice the FIPS column. That’s a federal code that uniquely identifies each county. We’ll need that FIPS number to merge this data with shapefiles of each county.
Download U.S. county shapefiles
ESRI, a mapping service, provides U.S. county shapefiles, which are in essence polygons that define the borders of a county. Download them here. Or from Storybench here.
Add shapefiles to Tableau Public
The shapefiles are in a zipped folder. In order to add it to Tableau Public, we need to extract the files. What we will use in Tableau Public is Uscounties.shp.
First, open up Tableau Public. Click Spatial file under “Connect- To a file” to connect the shapefile. What we will use later is the “Fips” column, which is recognized as a string. That’s what we need.

Clean the drug overdose data
Place a filter on your data so you can sort and filter columns. Find the Filter option in the data tab in Excel. By clicking the filter drop-down menu in the Year column, filter your data by the year 2015.
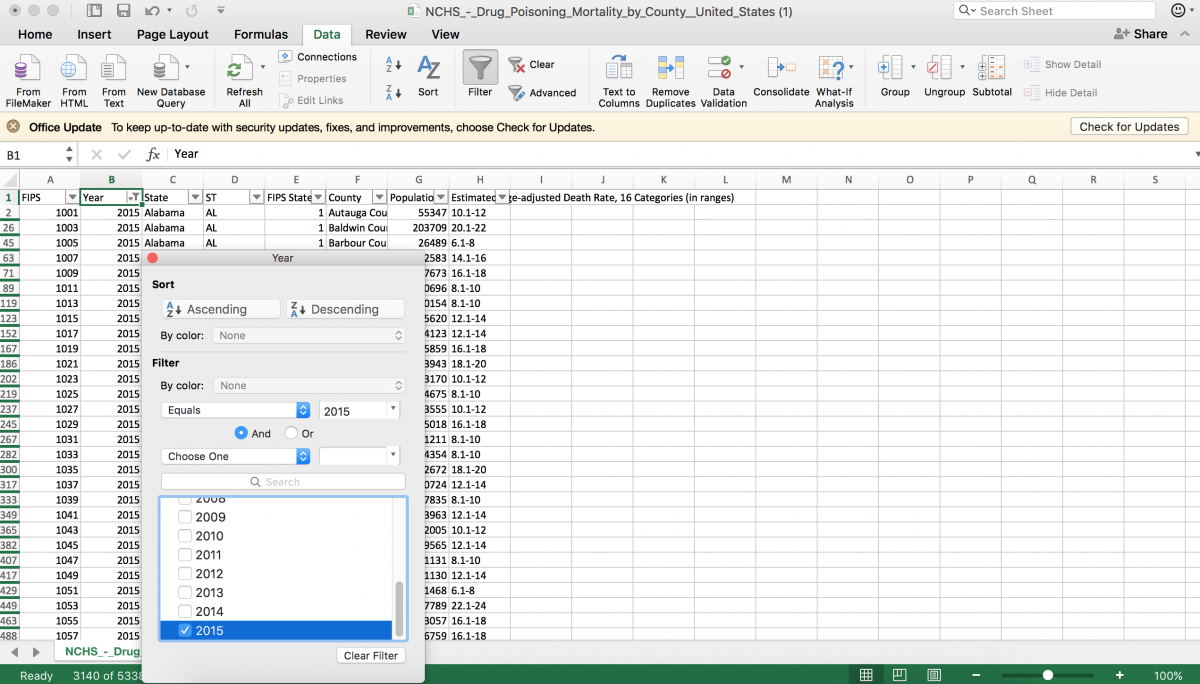
Then, select all rows and paste into a new sheet. This is a habit of mine and it helps me track any changes I’ve made between steps. You should now have 3,141 rows.
Next, we need to clean up the Estimated Age-adjusted Death Rate column. We need to decide how we will distribute this data. Notice The New York Times map has broken the data at 4, 8, 12, 16 and 20. So, recognizing that this is an editorial decision, let’s begin replacing every instance of 0-2 with 2, 2.1-4 to 4, 4.1-6 with 6, and so on until >20 and replace that with 20.1. (Use the Find & Replace function to semi-automate your process. Save the finished file. Download ours here.)
Then, since Tableau Public cannot recognize FIPS “1001” as “01001” even when it is in a string format, what we need to do next is change the FIPS column into text in Excel, converting the numbers into five digits, so that we can join it with the UScounties shapefile perfectly.
(I use the Excel formula =TEXT(A2, “00000”) to tell it to format the column the way I want it).
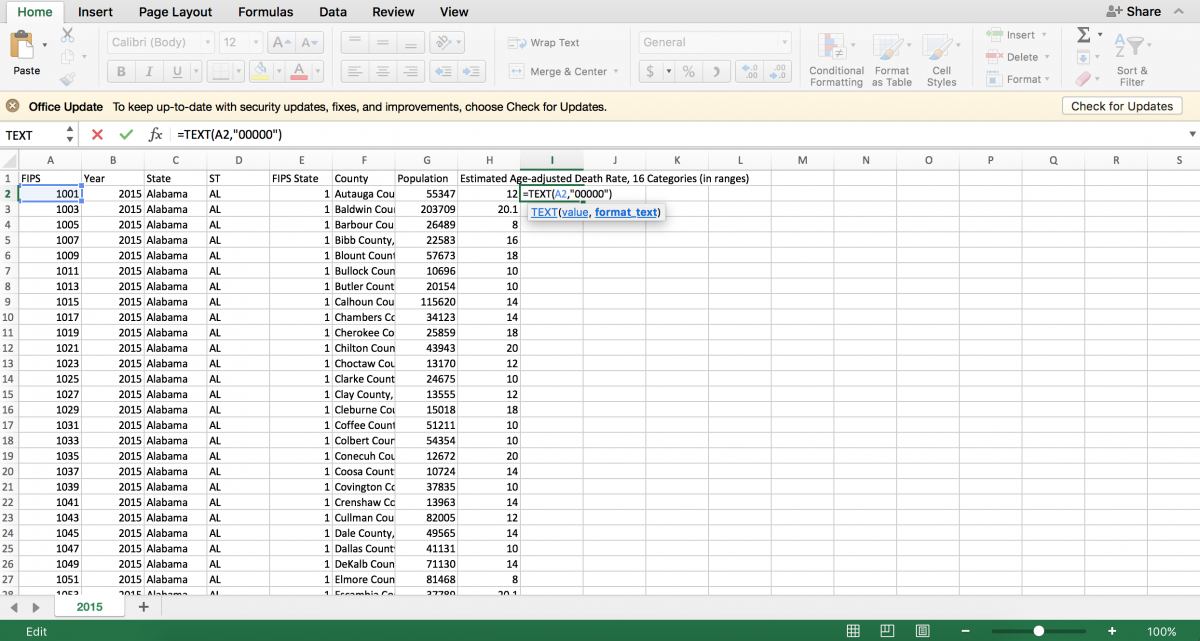
Finally, save the file.
Add cleaned spreadsheet to Tableau
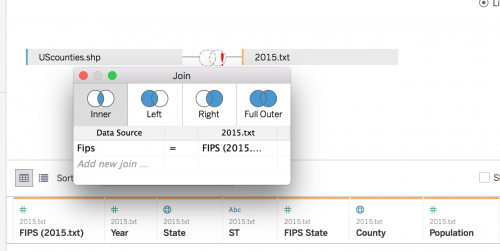
Add your cleaned spreadsheet. Then, select inner join, making Fips=FIPS. (Don’t forget to change column FIPS in 2015.txt into a string format.) From there, Sheet 1 should open in the application.
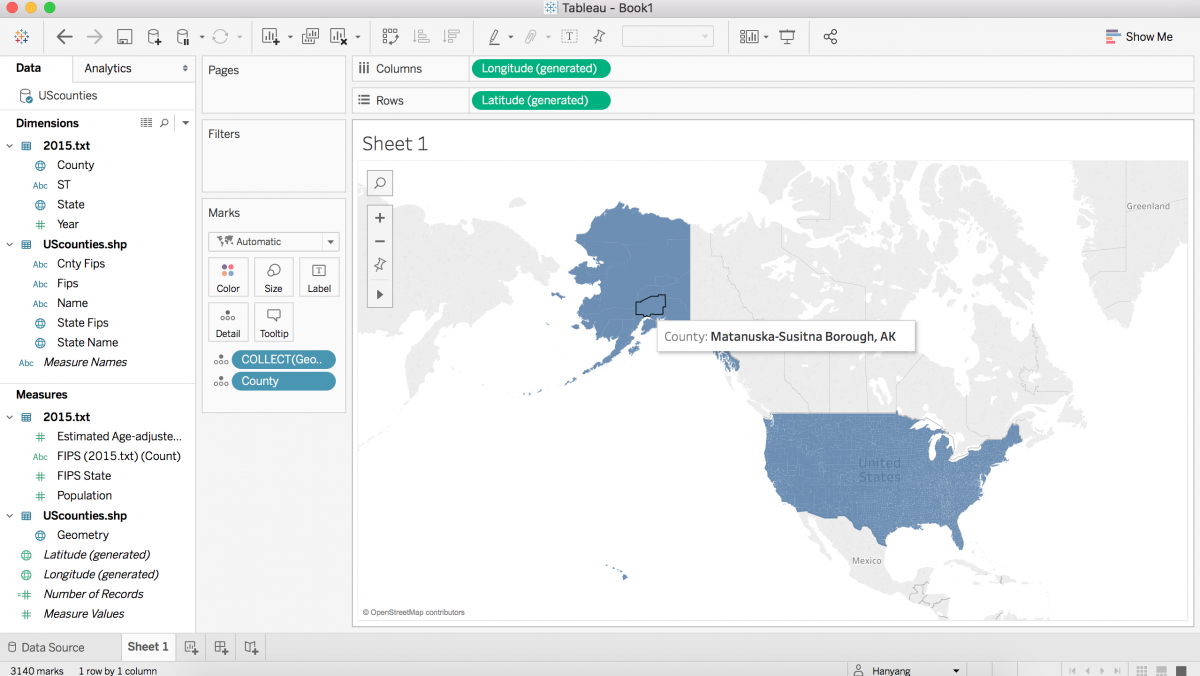
Now you can begin to visualize the 2015 data. Click sheet 1 to get in. You’ll see that the page lists a number of dimensions in the left-hand column. To initialize your visualization as a map, drag “geometry” directly to the blank area in Sheet 1.
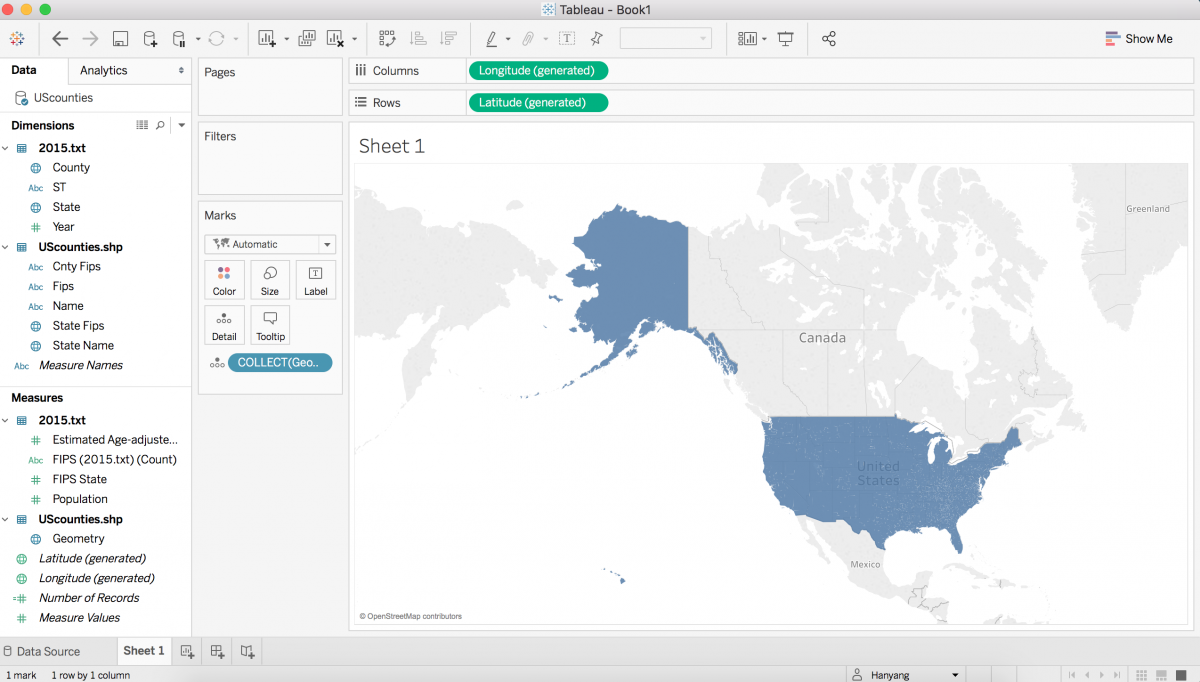
It will highlight the border or America with counties insides. Then, drag County from 2015.txt to the map.
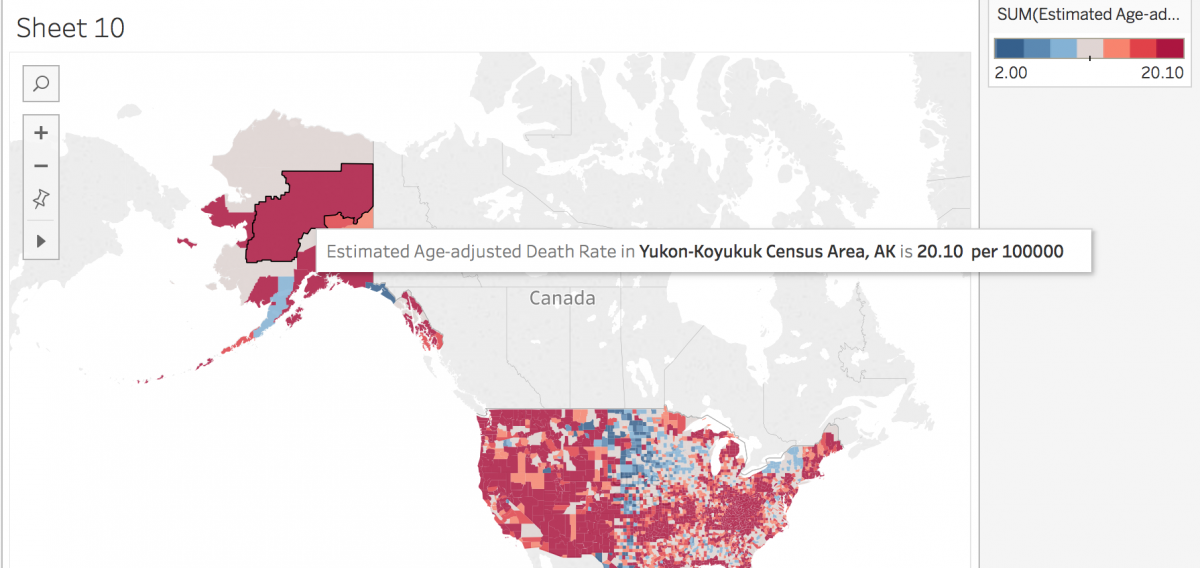
Then when you hover, it will show the specific county and its name.
Design your county-level map
Drag Estimated Age-adjusted Death Rate column to “Color” under “Marks” and Tableau Public will automatically assign a color to the values.
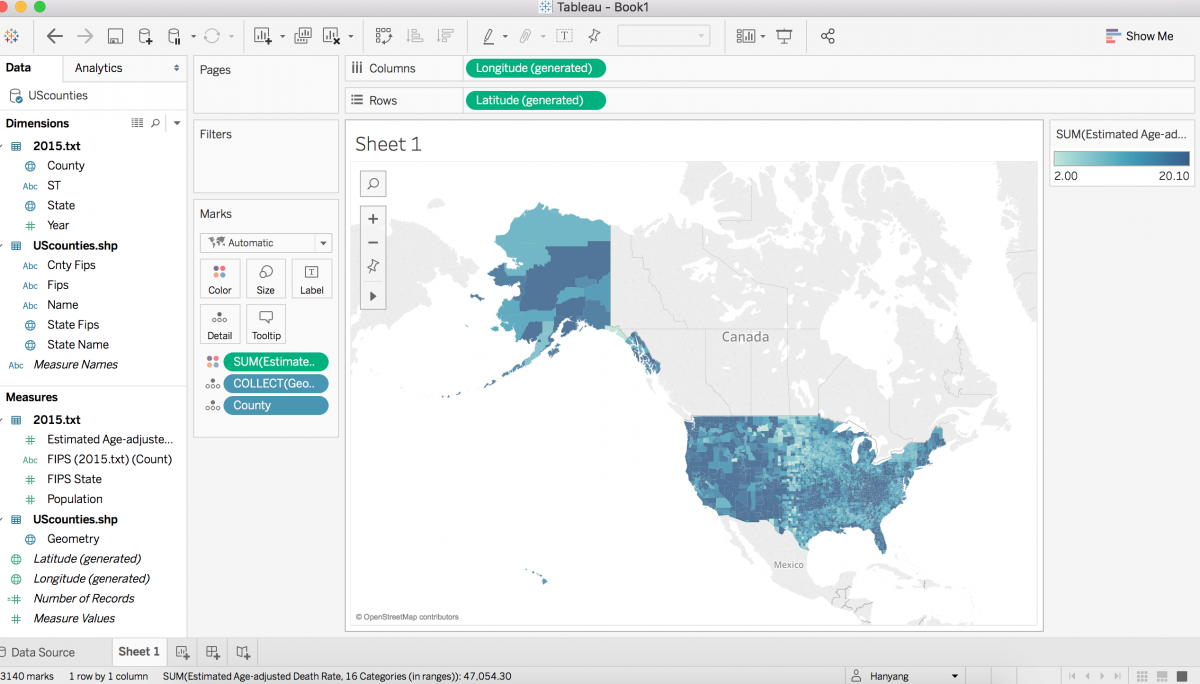
To change these colors, click on the color option, then edit color. Choose a palette. We cannot change every color like we can in Carto, but there are still some neat options.
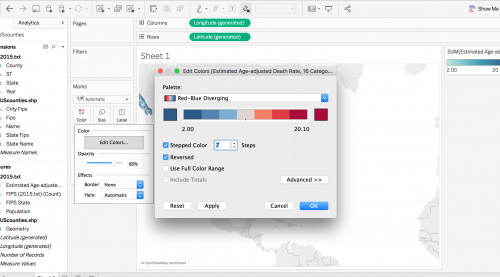
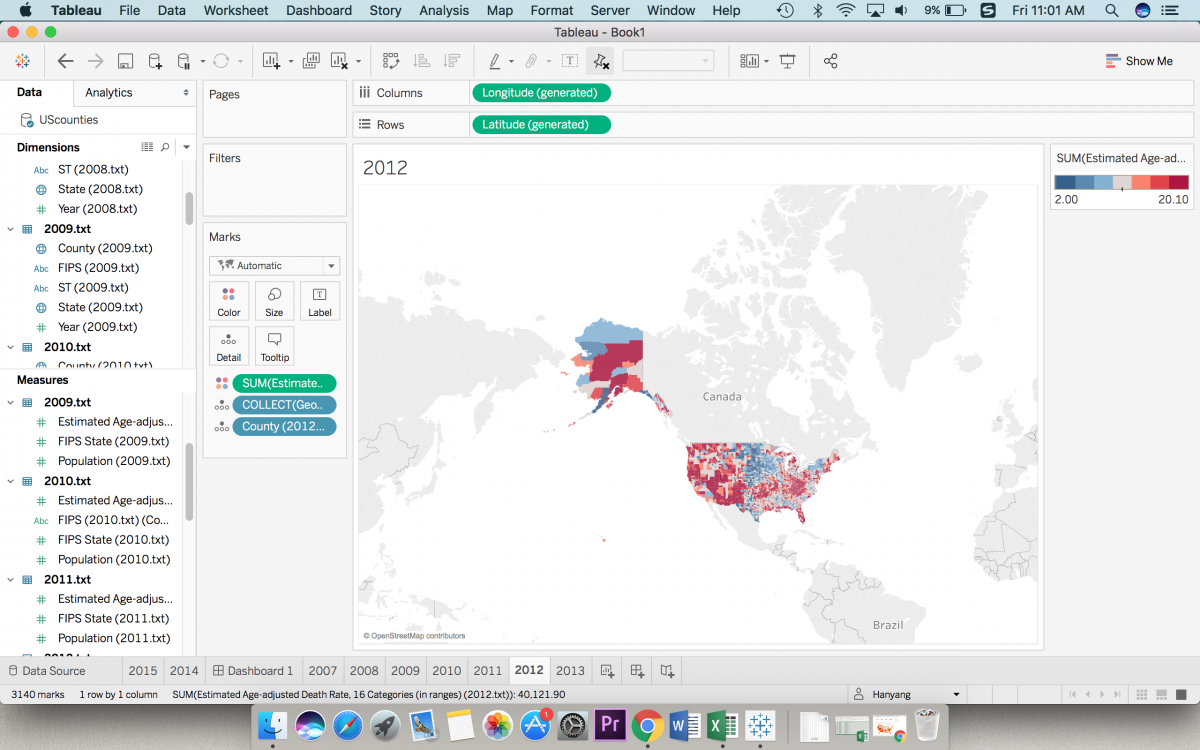
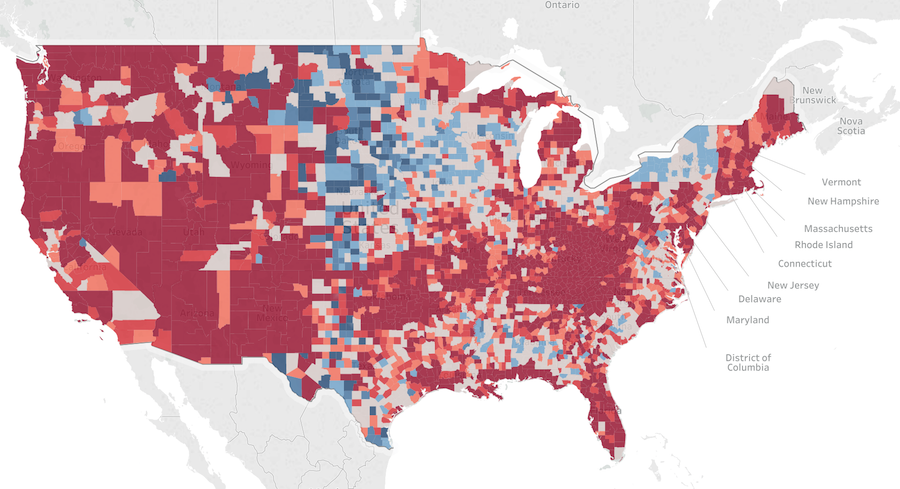
I choose red-blue diverging, and 7 stepped colors to make it more similar to the map on The New York Times. Then, I removed the border.
Make your map interactive
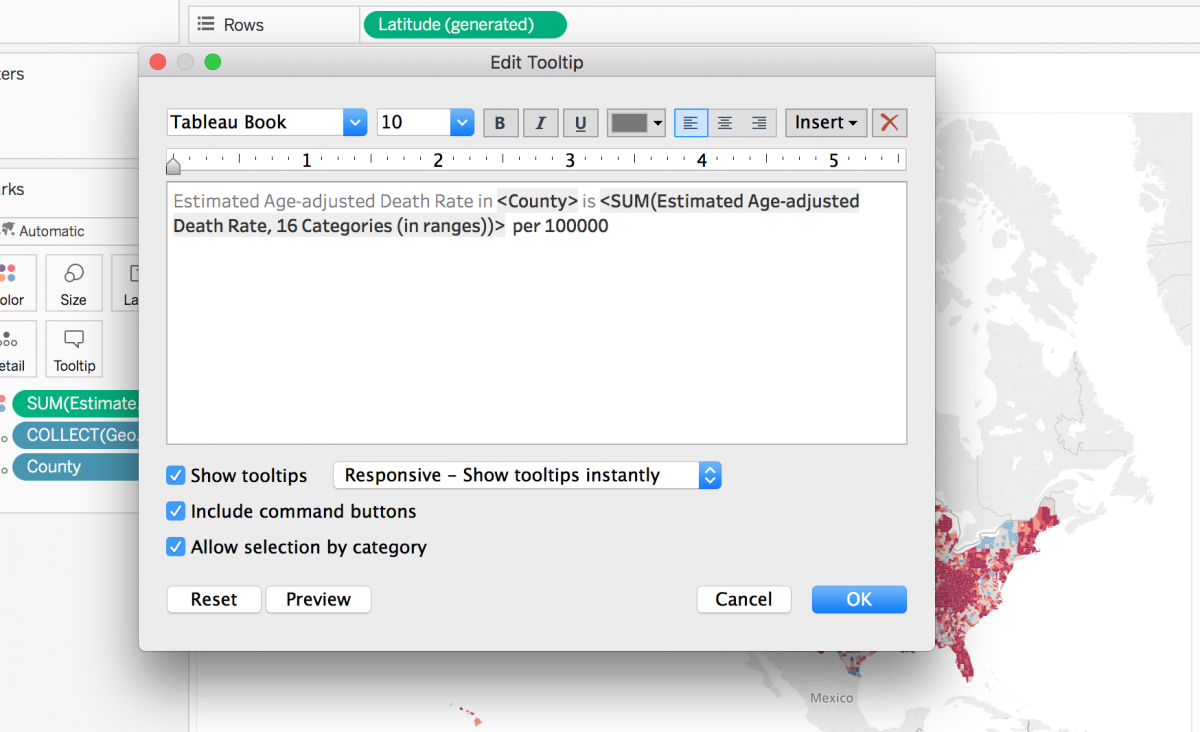
To make your map interactive, double-click on tooltip. Since I would like to show some text that says Estimated Age-adjusted Death Rate in [county name] is [the number of overdose deaths] per 100000, I need to write the following:
Now, when you hover, you’ll get this:
Exporting your map
Finally, to export your map, you could use Worksheet -> export -> image to get a static image or use server -> Tableau Public -> Save to Tableau Public to upload it to Tableau Public, where you could share the URL or copy the embed code.
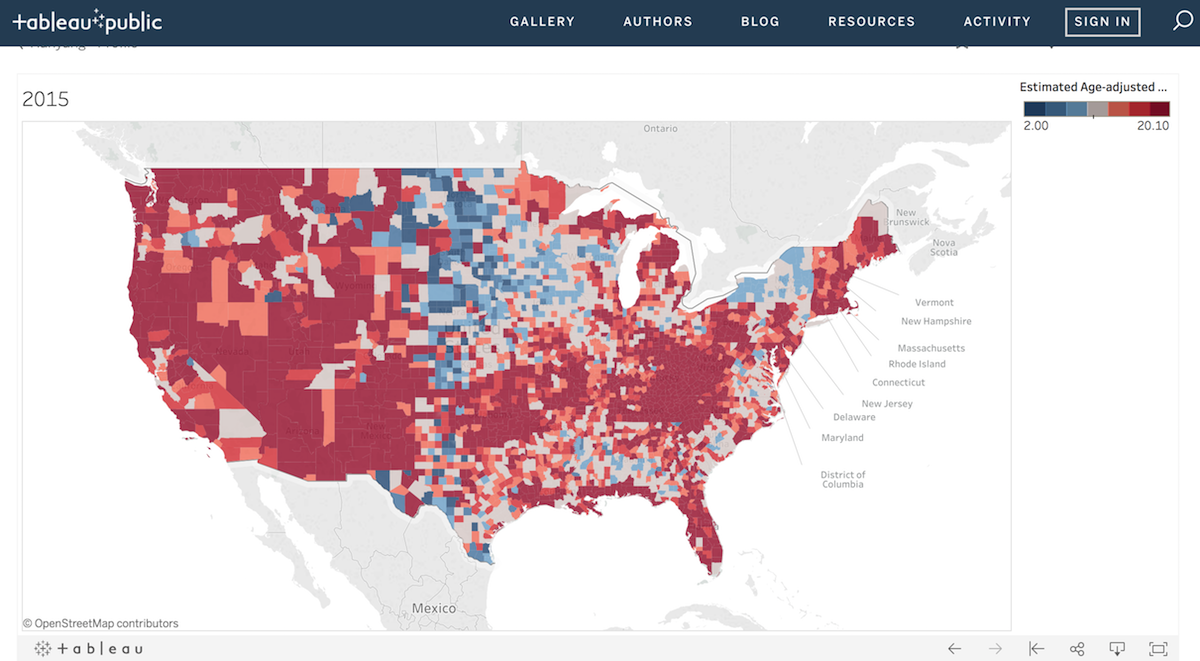
Here’s the final version:
Make multiple maps
Once you’ve completed the above steps, you can easily create a grid of maps filtered by year.
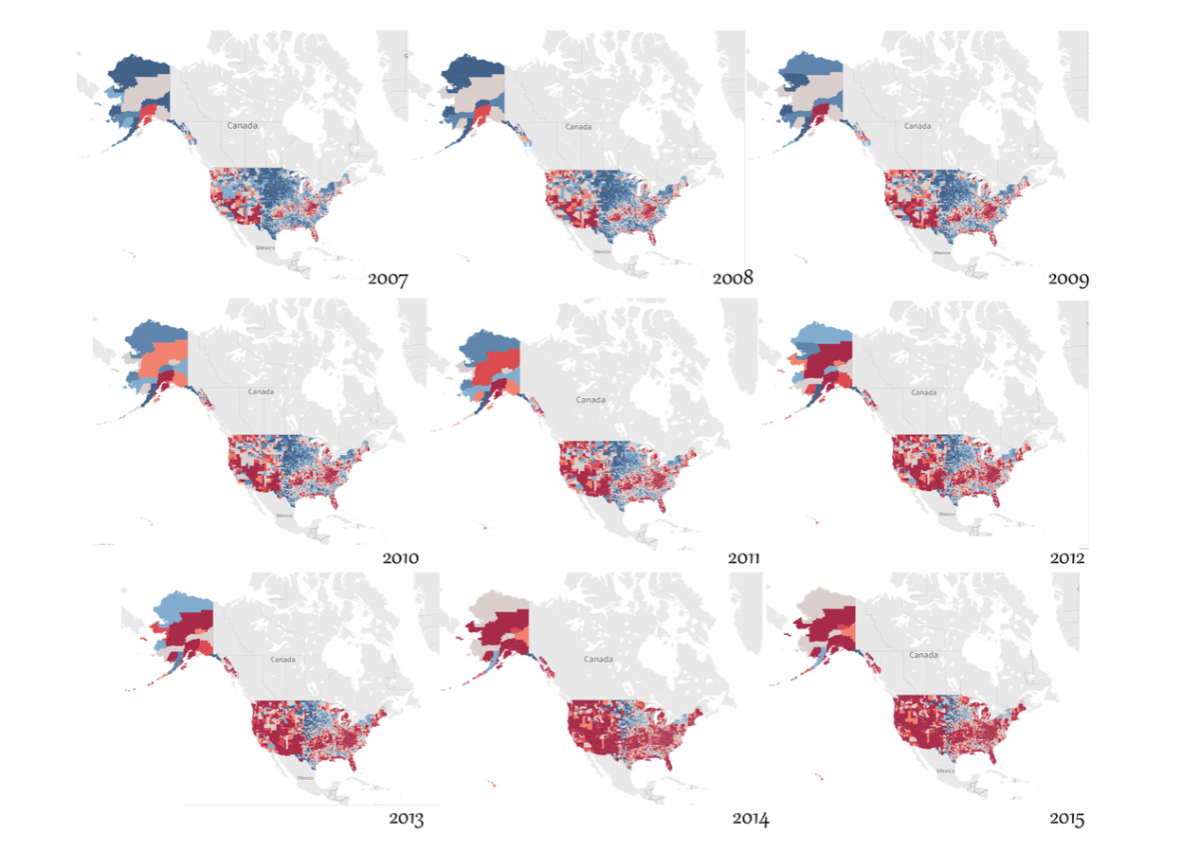
First, we need to add a “new worksheet” and then replicating all the things we did to make the 2015 map. Then create a dashboard and drag all the sheets into it. If we would like to make a static one, we just need to export all the worksheets and use a program like Adobe Photoshop to line them all up.
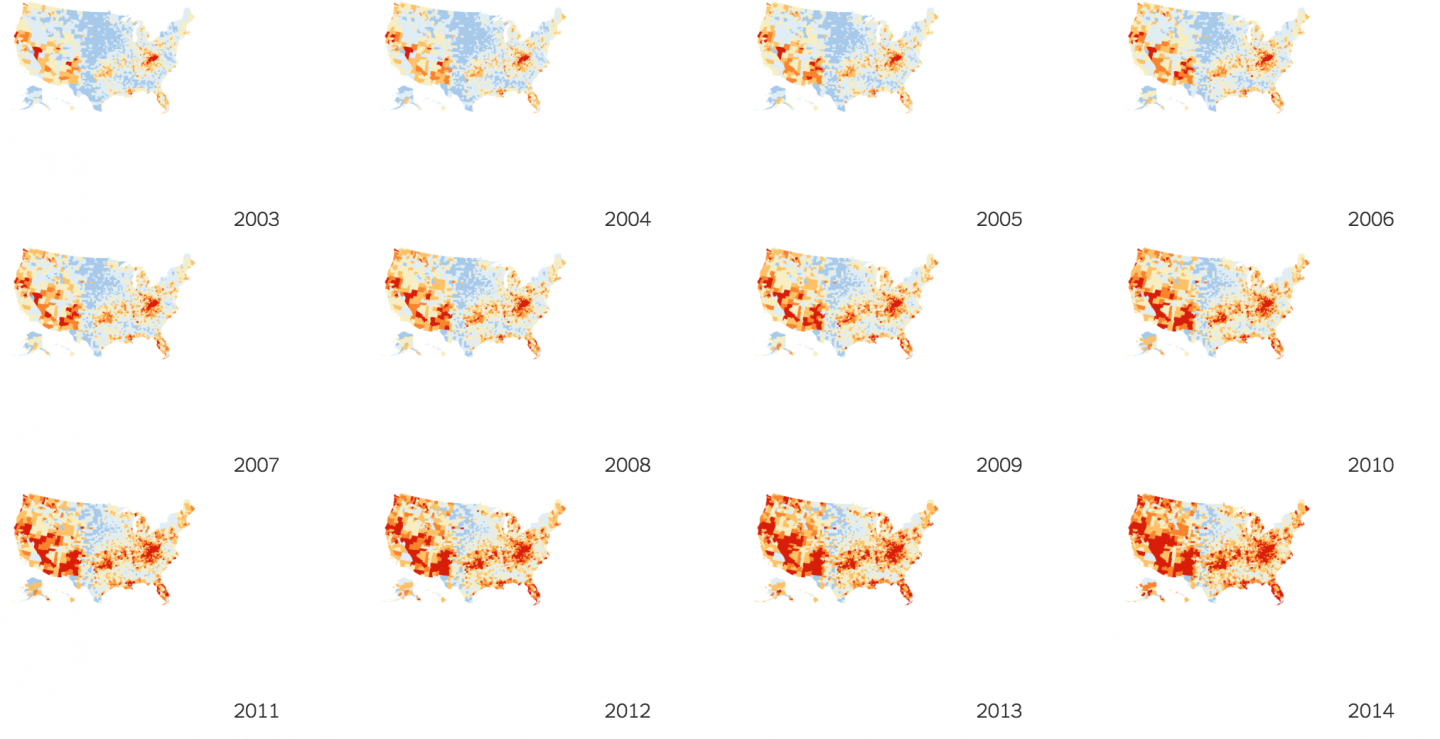
Here is the The New York Times’ versions:
And here is Tableau Public’s interactive version:
Made static, and touched up in Photoshop, here’s Tableau Public’s version:
- How to build an interactive county-level map in Tableau - December 11, 2017



I need help creating a layered map. I’d like to show a map of California with Lake County and the two incorporated cities highlighted (with city populations). It would be great if Clear Lake could be seen on this map as well to show where these cities are located around the lake. I’ve downloaded the trial version of Tableau and only will have it for the next 14 days. Thanks!
Hi there – CDC has removed that data set/blogpost. Do you happen to have a copy of it?