How The New York Times visualized the decline of clinics offering abortions after Dobbs
When Amy Schoenfeld Walker of The New York Times began reporting on abortion clinics after Roe v. Wade was overturned, she and her colleagues were shocked by how drastically the abortion landscape had changed, mere months after the decision.
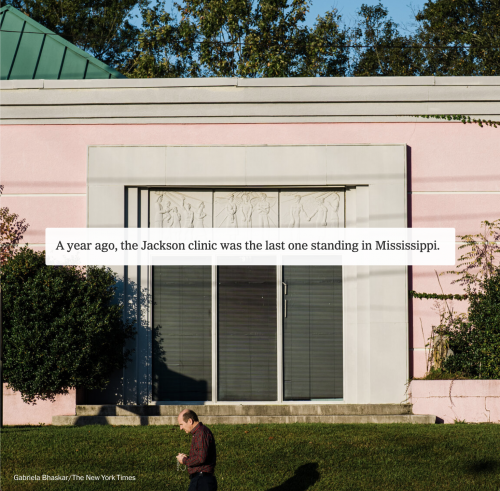
It began with “the Pink House,” the abortion clinic featured in the Dobbs v. Jackson case. What once was a brightly colored abortion clinic was now a luxury consignment store painted a sickly shade of white. Walker began to wonder, “What came of other abortion clinics across the country?”
One year after the overturn of Roe, 61 clinics had either closed, relocated or halted their abortion services. Walker and her colleagues were presented with a unique challenge — how would they visualize the decline of abortion without access to patients or clinics?
Storybench interviewed Walker and Shannon Lin, one of the digital graphic designers who helped create “One Year, 61 Clinics: How Dobbs Changed the Abortion Landscape,” to hear their insights into abortion reporting and interactive digital storytelling.
Did reporting on abortion change after the Dobbs decision?
Walker: I only worked on abortion coverage a couple months before Roe was overturned, so I don’t know if I’m fully able to answer that. But I do think that it definitely got increased attention. But we have a lot of colleagues who’ve been covering reduced abortion access in the years and months leading up to the overturn of Roe, in part because a lot of states were already starting to pass bans, and they’ve had restrictions in place for a really long time. It’s a really charged issue.
How were you able to find the 61 clinics featured in this article?
Walker: We knew we wanted to do something [about abortion] at the one-year mark of Roe being overturned. We really started thinking about this as we were hearing news about what was happening to the clinics. The story that got our attention was [that] the Pink House, which is the subject of Dobbs, had been sold. It was painted white. We were looking online on Google Street View to see if you could see that change. And then, there was a store that had been purchased by this luxury consignment shop owner and they were moving from one location to the Pink House.
We started to think about what we could find out about what’s happening to other clinics. What’s happening in all of these cases? Can we put those situations into categories? Can we use that to tell people about how the landscape has shifted? And so [my colleague] Allison and I started this spreadsheet where we were trying to pull together a list of clinics that had closed. We were cross referencing lists from different sources and…we were checking on the status of each one. Are these closed? Or did they shut down their abortion services? And are they offering other things? And are they pivoting to offer other services?
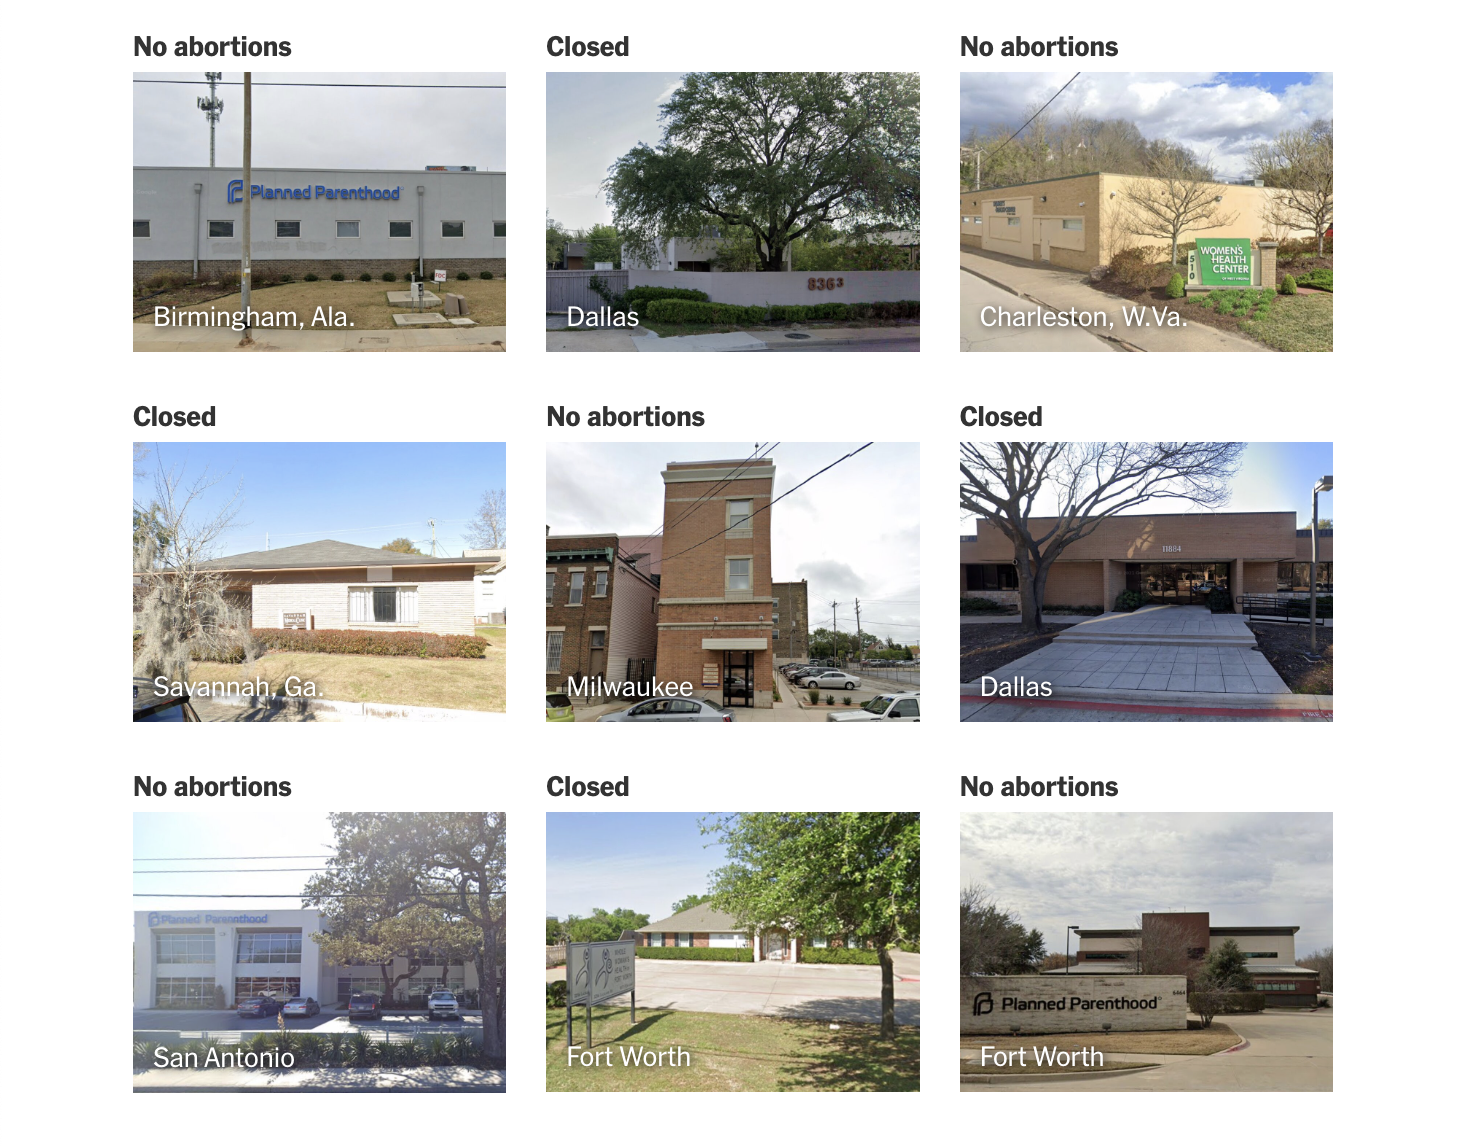
Lin: One of the big things in this design was prioritizing the scale [of closed clinics]. For one of the earlier iterations of the story, we wanted to start with the Pink House because that was kind of the main character of this story. But I think as we were building it out and reading it, it became clear that we wanted to show the extensiveness of the reporting and how many clinics we were looking at. So, that’s why we had the top with the grid [of photos] instead. That was a design challenge of sorts because we couldn’t do original photography, so [our photographer] Heather had to pull all of these Google Maps images.
What did you consider when seeking out content for an interactive article?
Lin: This article really utilizes a lot of the tools the design and graphics teams [use]. We had a map, a chart, grids of images and we had the scrolling. We have so many tools, so it’s really a matter of figuring out what works the best. And for something like this, in terms of design at least, we can go as big as we want. But it really depends on the tone of the story, [pacing] and what we’re trying to say. The use of scrolling was a way to break up the story in a more digestible manner. In a way, [scrolling] creates chapters in a story [where] the subject matter is a bit more serious. We wanted to make it more accessible for readers.
Walker: One of the things that’s been challenging across all of our coverage of this particular topic is it’s not incredibly visual if you don’t have access to patients or you don’t have access to clinics. It was really tricky, so it was very cool what [my colleagues] were able to pull together with the grid. It made it visually compelling. There was a lot of time spent on making the photos in the grid turn off a little bit and turn to white in order to make it feel a little more dynamic. I thought that was a very helpful way to bring people into this piece.
What platform are these interactive articles made on?
Lin: That’s such a hard question to answer. I would say that we have a lot of custom-built tools that are just for the Times’ newsrooms that developers, reporters and editors all have access to. It’s not really a platform, it’s more built into [the website’s] infrastructure; we have our own custom CMS (content management system)… The Times has a really cool history of being very experimental and developing newsroom tools for graphic storytelling. So, it’s not really one platform, it’s all these tools that have been engineered and built over the past 12 or 13 years.
How will the technology used and the data that you processed help future abortion reporting in the New York Times?
Walker: We caught something in a moment of time that would be out of date now, but it would be a starting point to revisit to rebuild a [similar] story down the line. We [have] source contacts for each one of these clinics, so it’s baseline reporting that we or any of our colleagues could revisit. Allison and I ran a tracker page where it’s a basic map and table that [kept] track of laws in place where abortion is banned, restricted or…protected across the U.S. We use that reporting as a base for many different stories. A lot of the data that’s built into this very simple map in this project is feeding and fueling other projects on [abortion].