How The Washington Post visualized the Republican primary debates
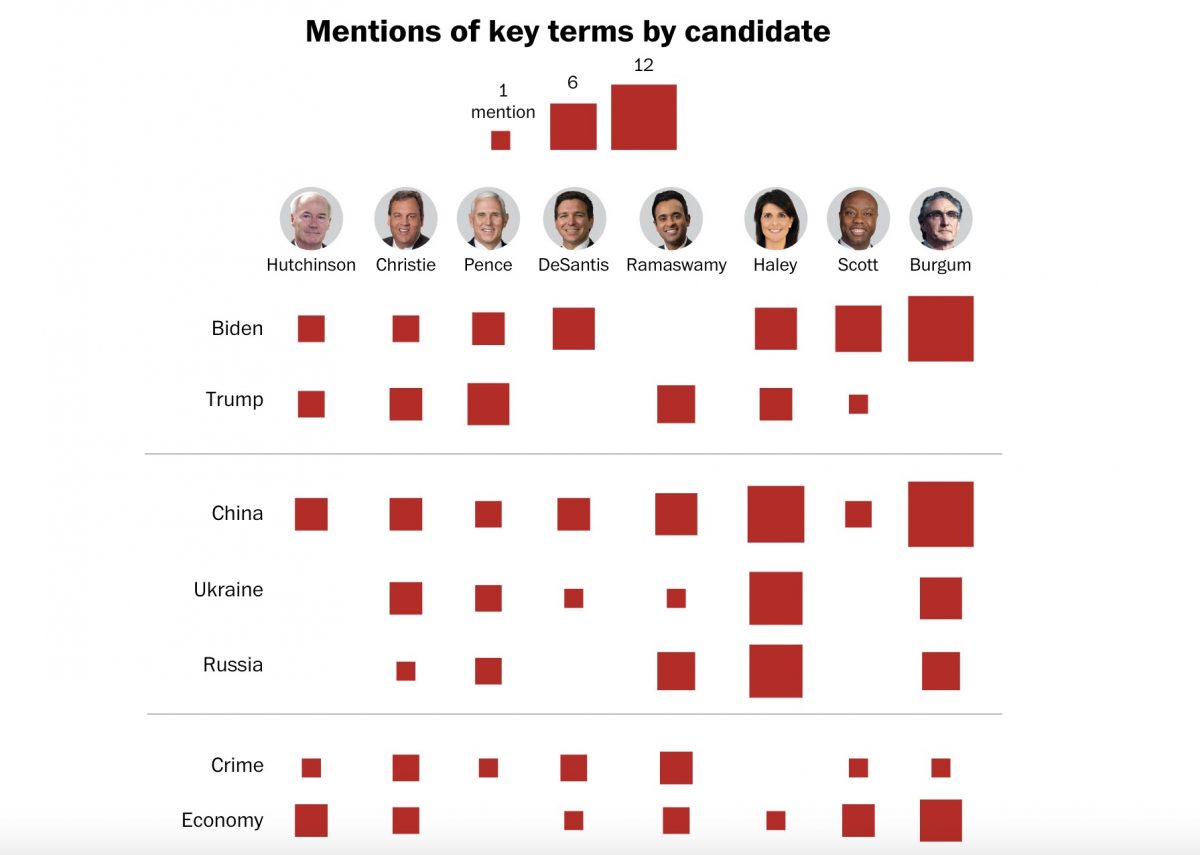
From the very first moments of the Aug. 23 Republican primary debate, Hannah Dormido was furiously scribbling in her notebook. Each time Trump’s name was mentioned, check. Hunter Biden, check. Ukraine, check.
Her process is a cluttered scramble, but the finished product is a clean, easily-digestible series of visuals explaining the debate’s key themes and narratives using data such as speaking time, attacks and mentions of specific words or people.
With data flowing in throughout the night and a tight deadline to meet the following afternoon, Dormido, a graphics reporter at The Washington Post, planned her visuals weeks in advance of both the first primary debate on Aug. 23 and the second on Sept. 26, while working alongside other colleagues, including Derek Hawkins, Nick Mourtoupalas and Hanna Zakharenko. The reporters focused on the debate’s key topics and trends ahead of time but also on executing small details like color schemes and the shape of arrows.
“When we’re working together and putting a lot of thought into it,” Dormido said, “by the end, we’re like a polished machine.”
Dormido began covering American politics when she joined the Post in 2020; previously, she worked as a graphics reporter for Bloomberg News, based in Hong Kong, and the Financial Times in the Philippines. She recently spoke with Storybench about the process of covering the debate for a visual story.
This interview had been lightly edited for length and clarity.
How does a visual story fit into the larger picture of debate coverage?
Dormido: The goal, always, is to reach the widest readership you can. So, it’s really a question of, “How do we present this in a more straightforward, easily understandable manner to our readers?”
I’m fairly new to politics coverage. And I’ve always assumed that a normal reader is someone like me, who is learning things as they go. Because we don’t assume that every person watches the debate, or everyone understands what’s going on. The role of the visuals is, number one, to bring you the highlights in a snapshot. What is this all about? What are my takeaways? And then from that, you leverage your text or leverage your photos and bring all that information together.
These debates are nuanced, and the topics don’t all fit into simple categories. How do you walk that line?
My belief is [that] a graphic story does not exist in a vacuum, [in any case]. We can’t expect one story to tell our readers everything. Even if there’s a lot of things in play, we also have to remember that our readers don’t really stay in stories for more than two minutes these days.
So, how do you get them to sit there and finish it? That brings you to saying, “what are the takeaways?” How can I explain this to a normal person without making them feel dumb? Your goal is to make them interested about the topic, give them the initial takeaways, and if they want to learn more, they can start exploring other stories.
Do you use prior knowledge or make specific predictions to inform design choices and map out a plan?
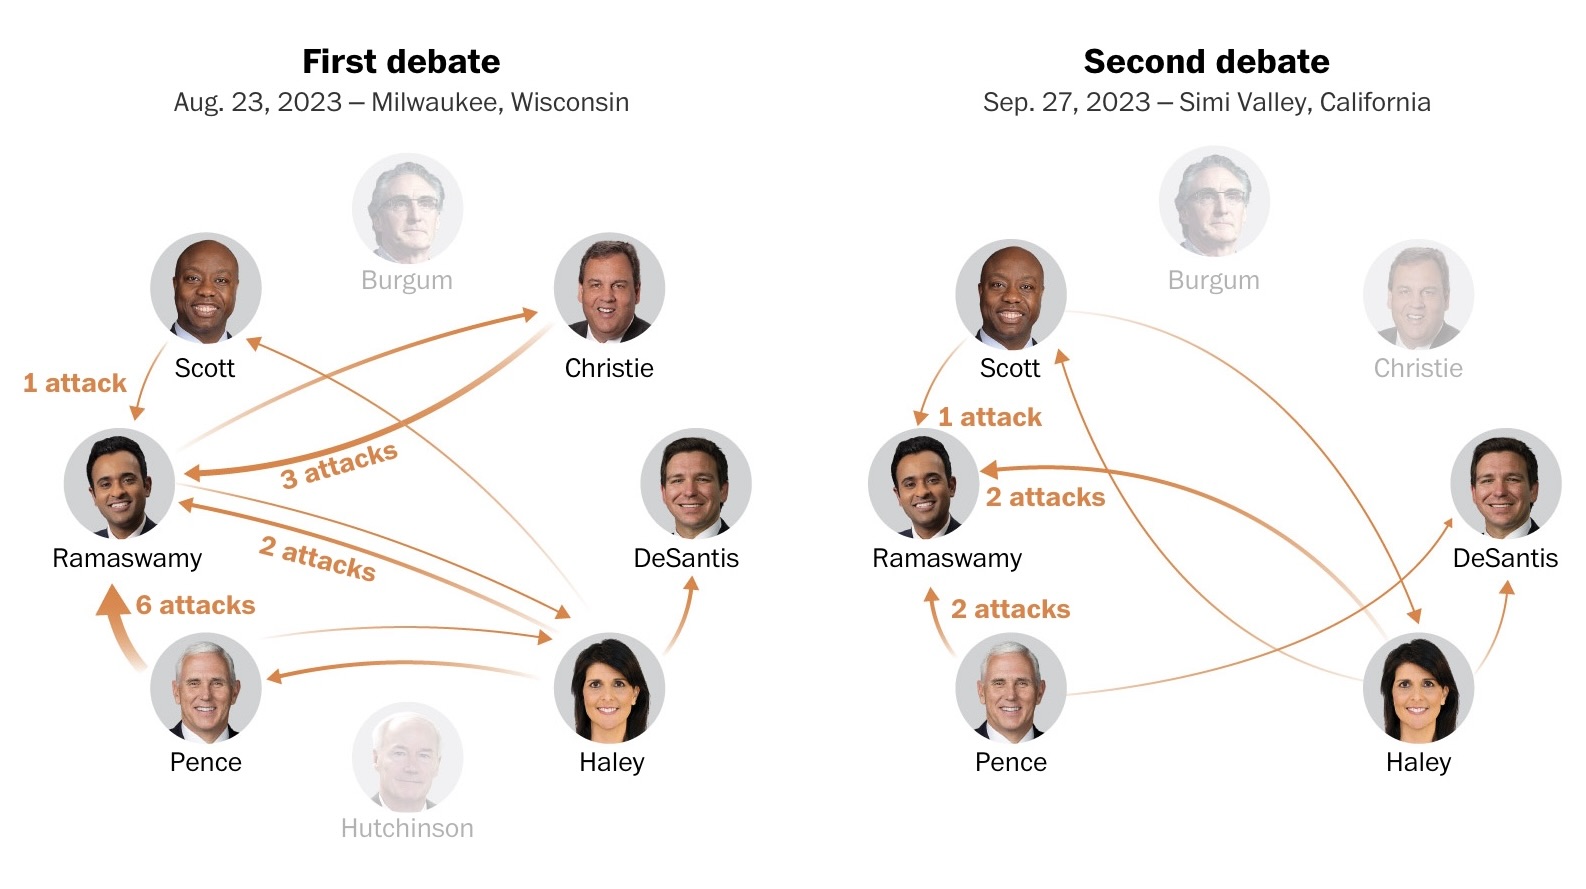
Before we come into a story, we already have different ideas of what might happen. It’s not that we say “Oh, [Vivek] Ramaswamy is going to get attacked.” But we always sit down in a group, weeks ahead and plan out, “what are the interesting things to see?” And a lot of these, you can actually gauge on the campaign trail to start seeing trends. But that doesn’t mean that you already write a storyline. It’s more in your mind…then you are ready to react in real-time and prepared.
Especially since the ‘data’ you are visualizing isn’t a typical dataset, how do you ensure accuracy?
It doesn’t add on paper or just from my personal counting. While the debate was happening, I was writing down keywords, what are we interested in, things like that. And then we had to wait for the transcript and confirm, and then that’s where you count [officially]. So, we had a vague idea of how many times Trump was mentioned, and in my list, for example, I had like 12 — but it was off by two once we confirmed it with the transcript. And then once you have the right numbers, then you edit your chart.
How do you make sure the design choices sync into a cohesive story, especially if your collaborators are all working on separate visualizations?
We have a template. We have fonts and colors that we use, we have ai2html templates that we actually use in most of our graphics. So, this does not exist in isolation. Coming in, we knew that we have a color for the Republicans and we have headshots for them.
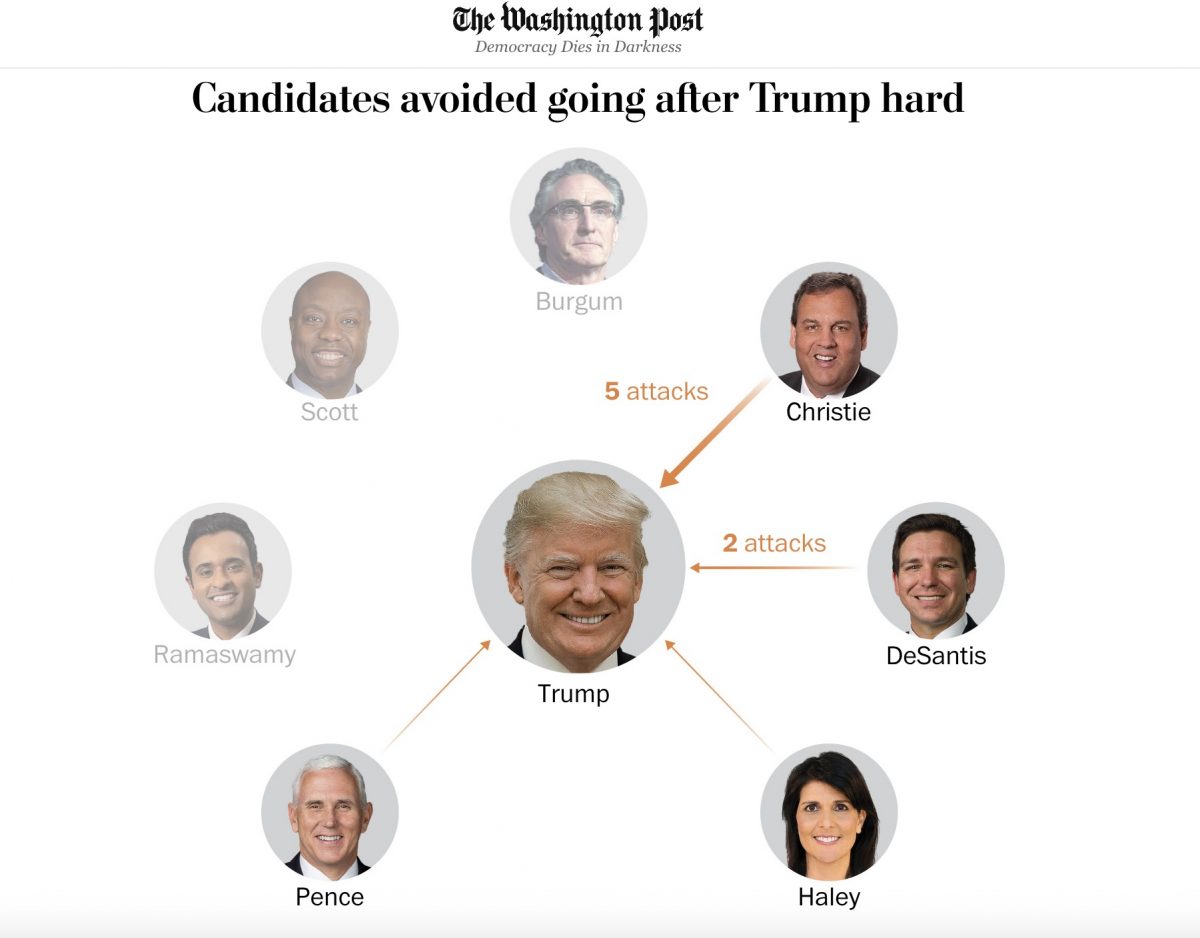
If you look at this graph, it was sketched out beforehand. We knew, if we were going to end up making a graphic about this, we already had the headshots ready, we had the color, the arrows, the font sizes. We knew that if this chart was going to see the light of day, we had to have a rough draft ready.
And how long does that preparation process take for the chart?
Oh, it takes a lot of edits, to be honest. Sometimes, I sketch it four to five different ways and then it doesn’t look as polished as it did on paper and could be just a bunch of lines. A simple graph like this could take weeks of sketching out and it’s all about figuring out the right way of doing it. Should it be a circle, should there be thick lines here?
The night of [the debate], we had a bunch of drafts. But then, each of those charts needed to be resized a number of times, and ai2html is this script that allows us to basically create responsive charts. So, one chart needs to be resized four times.
People just assume you have one chart, and it’s easy. But no — I have to make four different versions. You see it on mobile, you see it on your iPad, you see it on your computer and it’s the best possible experience for each. Everything comes back to the reader.

- How The Washington Post visualized the Republican primary debates - December 6, 2023