Kontinentalist shows the legal battle for women’s divorce rights in the Philippines with visual and data storytelling
In the Philippines, divorce is still illegal for all citizens, except for the country’s 6% Muslim population. Due to obstacles set in legislation, along with deep roots of Catholicism in the country, many Filipino women have to accept that they’re unable to file for divorce.
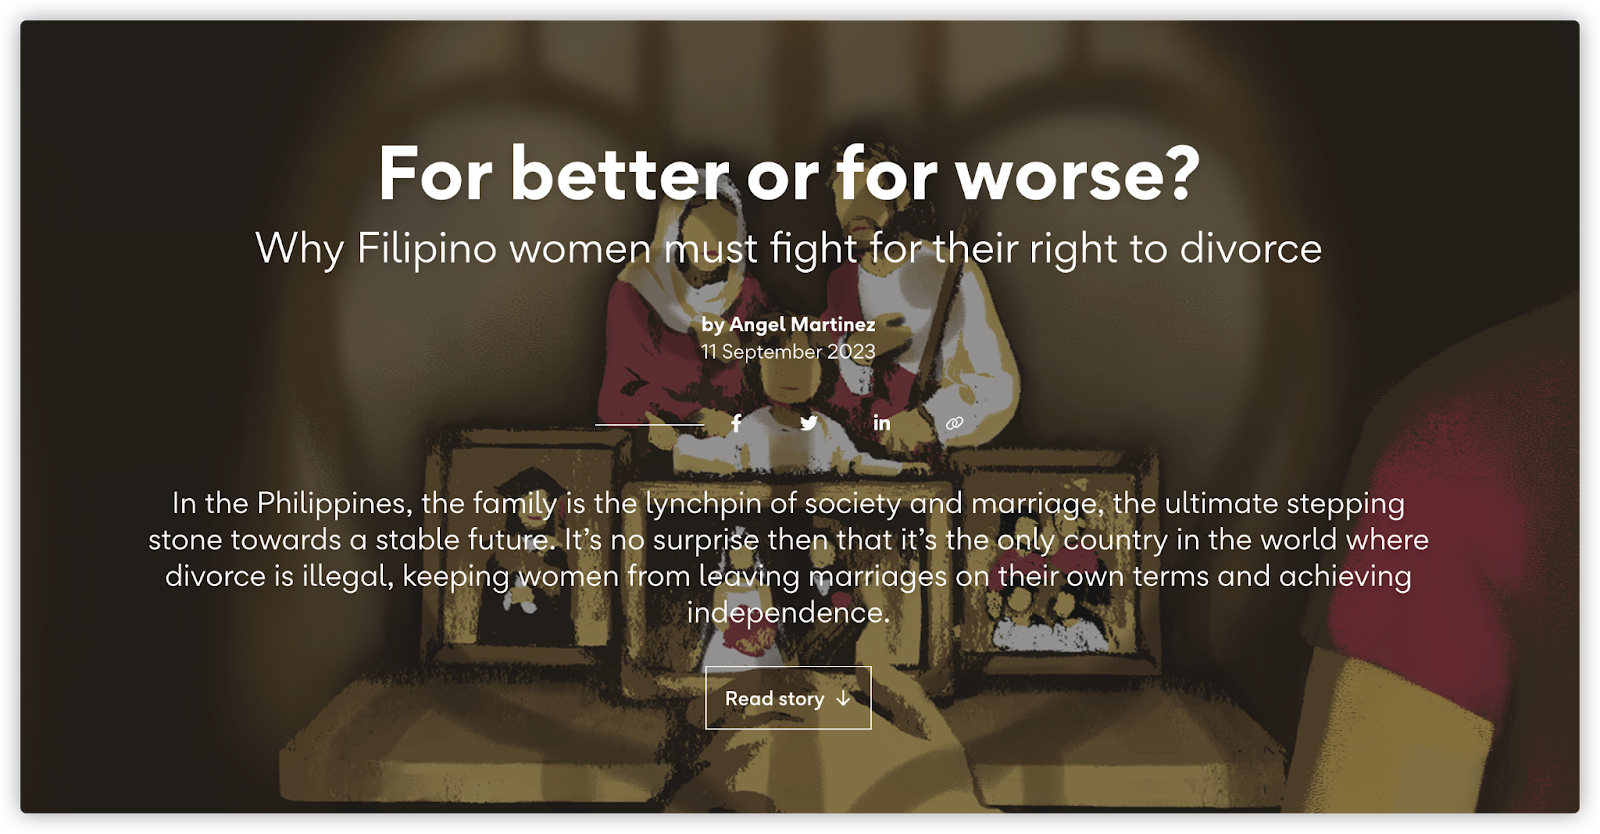
Kontinentalist, a data-driven digital publication based in Singapore, published a visual story titled “For better or for worse?” about Susan, a fictional Filipino woman who has been trying to divorce. Aided by data visualizations and illustrations, the story takes readers through the long and complicated path to legal divorce in the Philippines.
Storybench spoke to the team who published the story: writer Angel Martinez, illustrator Griselda Gabriele and data visualizer Bianchi Mendez Dy about the three months spent producing the story.
The following interview has been edited for length and clarity.
How did this story come about?
Martinez, based in Manila: The idea for the piece started because I wanted to bring a Filipino issue to the forefront for Kontinentalist. One thing about the Philippines that I felt like not a lot of people knew about, but demanded a certain level of urgency and attention, was the fact that we are the only country in the world without divorce [aside from Vatican City].
The story [presents] a confluence of factors: a Catholic or a strictly Catholic upbringing, our law justice system, the state mandate for serving the family. And after realizing that there’s just a lot to unpack in that arena, I got Bianchi and Griselda on board, and this dream team came to be.

How long did the project take? Can you walk me through the process?
Martinez: I started with the writing and then passed it on Griselda for designing. Since this is a very distinctly Filipino issue we were handling, we were apprehensive about the approach that we were going to use. We didn’t want to serve audiences just cold, hard facts because it was not like a lot of people could relate to it. We wanted as many people to empathize and see the urgency. That’s how we made the decision to introduce a fictional character. We wanted a character who was very Filipino in the way she behaved, she thought and she acted, so readers accompany her through very Filipino locations and Filipino contexts.
Gabriele: I believe the project took about three months. After Angel passed the story to me, I started thinking how the story was structured, like place and space. There’s the home, there’s the church, there’s the law, the legal office and then there’s the community at the end. The data visualization planning was also divided based on that. For example, the start of the story is the home for the character. And then I went to the illustrations. Because, honestly, Angel’s story was very cinematic at that point.
Dy: I think the challenge is that divorce is such a sensitive issue in the Philippines. What made this hard is that no one wants to talk about it. And the reason why is that there’s still a lot of stigma and shame associated with seeking legal separation or anything equal to a divorce. For this, the data was extremely hard to get. What ended up happening was that my mom, who was a lawyer, helped us. We had to reach out to some of her contacts to see if anyone could speak about it from the legislative perspective. And what ended up happening was we were very lucky to meet a certain professional who had worked in all three branches of the Philippine government.
How did you make the visuals and written story cohesive?
Gabriele: What helped us overcome that was we had meetings and discussions, brainstorming about the data visualizations quite early on. At the time, Angel had an outline. I just simply designed an outline we wanted to have. I think each of us had hypotheses or an answer that we were convinced of — which is a possible issue in the data storytelling process. Instead, we should be open to what insight the data may bring. And then to wireframe it how we usually do, we use Figma.
Dy: Our editors would always call us out when we strayed too far from making visuals coherent. This is an issue we have faced in many stories, and it’s very easy to treat visuals as not part of the text. But they are. Not as deeply intertwined as comics, where text and image go together to give meaning to each other, but you cannot have one without the other. And maybe, I think, after reading and understanding the comics, I’ve begun to try and approach that a little differently. Then I think what our editor is really trying to tell us before, which is, you must create both side by side, and they must be inseparable. And this process is, I hate to say it, it’s really messy because you’re so attached to something.
Martinez: I remember when we were putting the story together, I had so many things in mind. I was really looking at pretty ambitious data visualization ideas. But because we were focusing so much on what we wanted the visuals to look like, we didn’t really take into consideration whether they supported the story or the strength of the message. That’s big for me, aside from the fact that you should really consider both, side by side when you’re writing the story and thinking of the data, versus just thinking of what you want each step of this to guide the larger story.
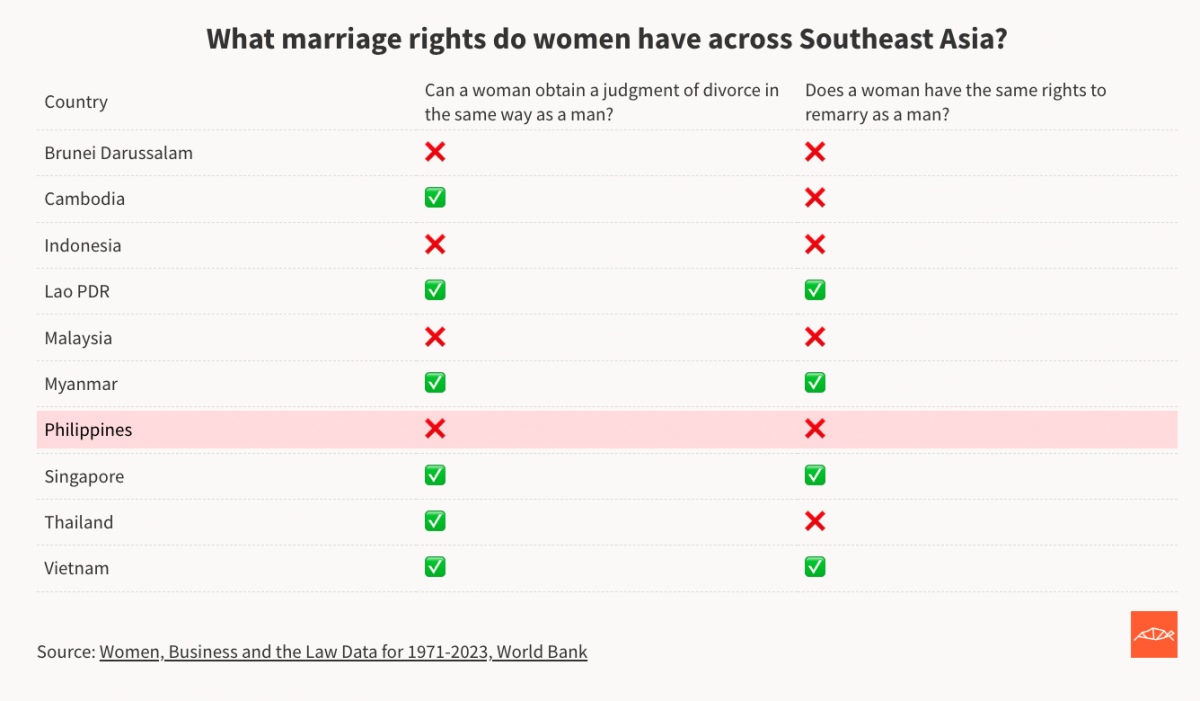
Editor’s note: We adjusted a part of Gabriele’s quote in the last question for clarity and also added an image of the marriage rights visualization. We regret not making these changes upon publication.

- 35+ data visualization tools that The Washington Post uses - April 16, 2024
- Kontinentalist shows the legal battle for women’s divorce rights in the Philippines with visual and data storytelling - February 27, 2024
- Reuters: Journalism and technology trends and predictions - February 15, 2024


