Here’s a look inside the data team at the Associated Press
Founded in 1846, the Associated Press is perhaps best known for its quick and accurate breaking news reports, widely republished worldwide. But, just like in other newsrooms, AP journalists are actively working to incorporate more data storytelling into their coverage.
With data reporters embedded on local desks across the country, the AP is committed to elevating the quality of their data work, which includes creating more data tools and sometimes incorporating visualizations into breaking news reports.
Storybench spoke to four AP data journalists located in different cities throughout the country — Sharon Lurye (New Orleans), Mary Katherine “MK” Wildeman (West Hartford, Connecticut), Kavish Harjai (Los Angeles) and Chris Keller (Albuquerque, New Mexico) –– about how their newsrooms incorporate data into all types of stories.

The following interview has been edited for length and clarity.
How does the data team operate at the AP?
Harjai: Most of us are embedded on a beat team. So, MK, climate; Sharon, education; me, state government. We also have people who do [beats such as] health and science, public health and race and equity. There are some reporters on the data team and analysis team that aren’t embedded on a specific team, like Chris. We have a few others who do more breaking news or document collection.
Lurye: Our roles have a lot of autonomy and flexibility. Around half the time I’m working on stories where I’m assisting another reporter with a story. The other half, I’m looking into stories where I’ve noticed trends, or I’ve had an idea, pitched the story to the editor and gotten approval to work on it on my own.
Wildeman: Data visualization is part of what we do, but I actually would say it’s not our primary role. We have a dedicated graphics team, and we have an entire interactive team. But we are really focused on [thinking of] the most impactful way of communicating our findings.
How does the data team collaborate with reporters on breaking news stories?
Lurye: An ongoing goal for our team is to be more involved in breaking news. When we have our weekly meetings and our daily standups, if something comes up in the news that has a data angle, we try to see if people can contribute to that.
For me, since I’m on the education beat, there usually isn’t a whole lot of breaking news that I need to cover. Usually, most of what I work on is long-term investigations. But for example, the Supreme Court decision came out overturning Biden’s plan to cancel student loan debt, and that was the kind of thing where it was all hands on deck.
Wildeman: One of our team members built a hub of information that reporters needed for COVID statistics that everyone was struggling to find at the time. So, this is a void that our data team has filled in the past and is hoping to fill more: being able to inform our reporters and what they turn to in terms of statistics. It’s a constant struggle, but we try to be as integrated as possible into what reporters are working on, on a breaking news basis, because really the core of the AP is breaking news.
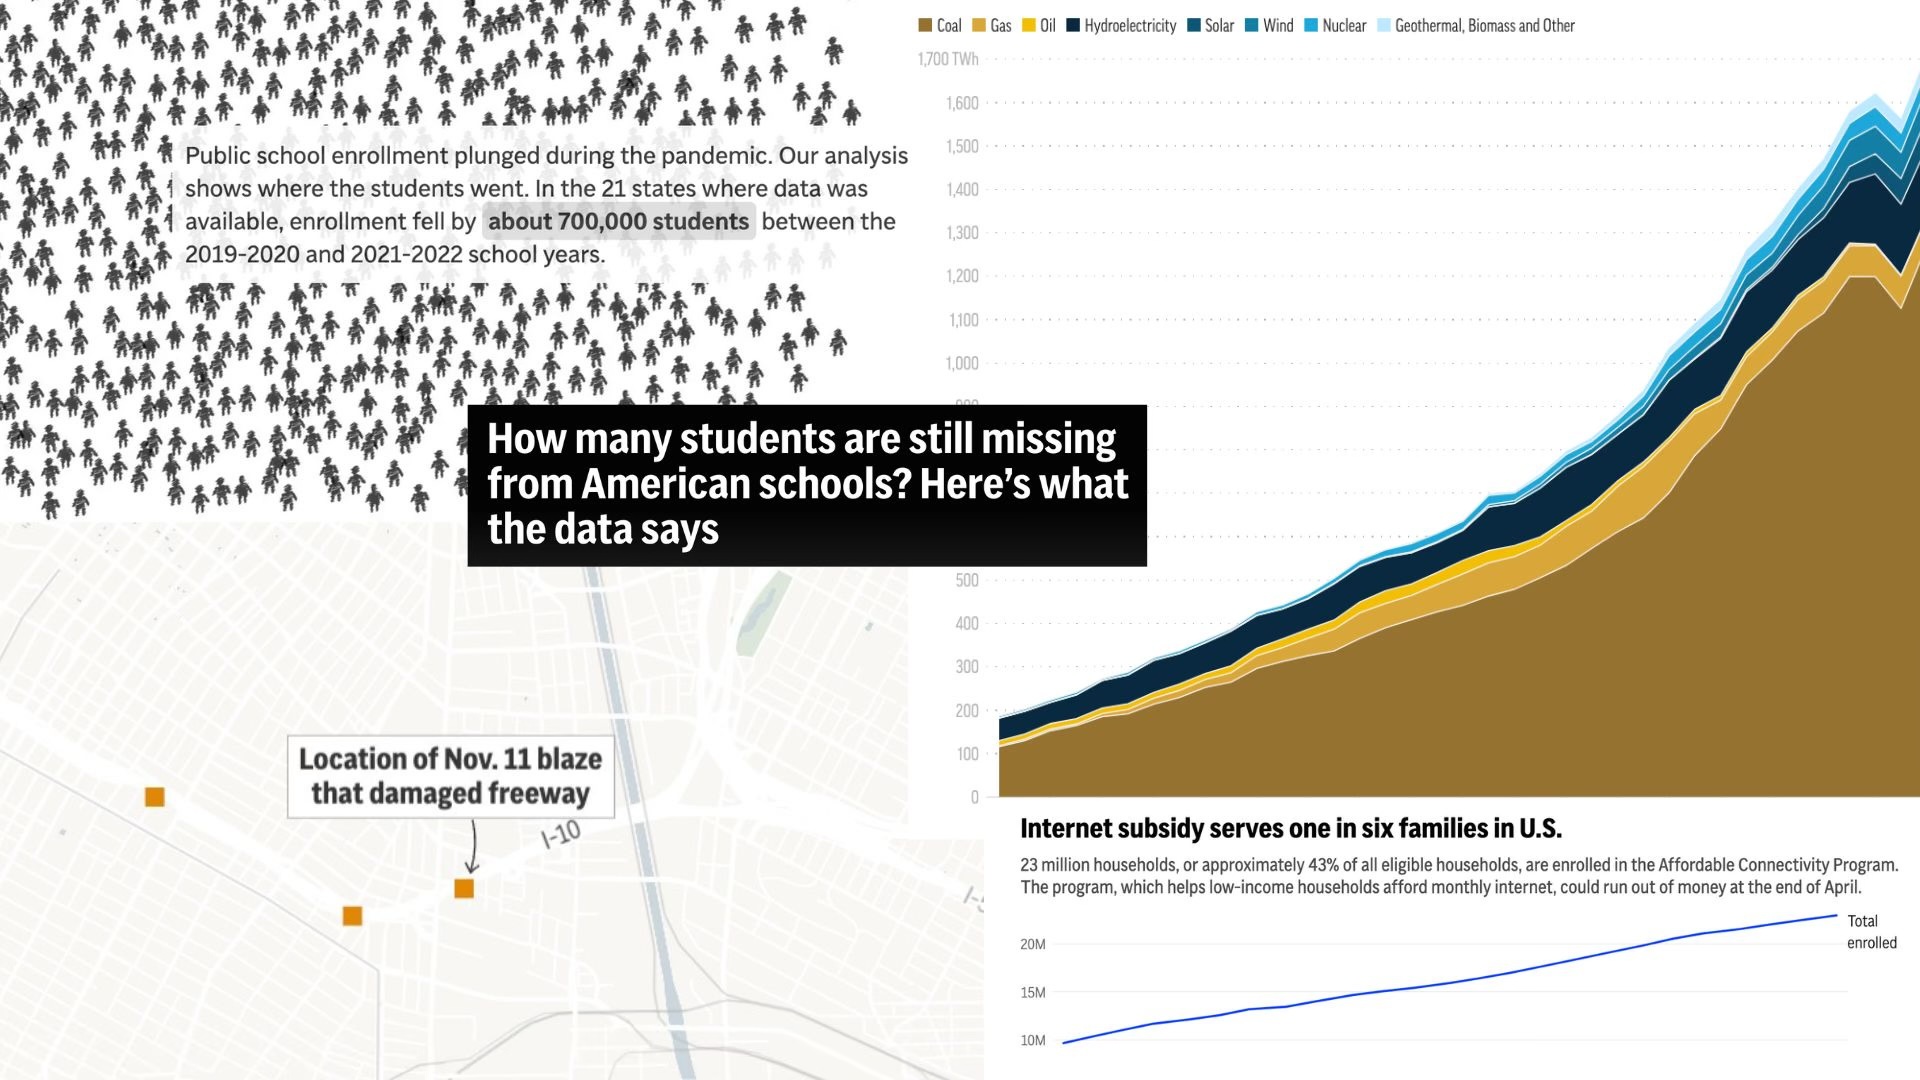
Harjai: The strength of a data analysis team is usually to do some sort of longer term riff off of a breaking news event. [For instance,] there was a fire under a freeway in [Los Angeles] in November.
We analyzed data on the state program through which this land under the freeway was leased, and we also figured out that the person who owned the property has four other properties in Los Angeles County. Then, we were able to look more into his properties and see he doesn’t take great care of those properties. So we were able to take that one breaking news event, see how it looks on the scale of the state and then focus more on one person that we eventually produced a long investigative story on.
Keller: Our strengths are the second-day story providing context and a deeper analysis. But one of the goals that we have had, and one of the things that I was brought on to do, is to add a sentence or two with some basic information and build those data sets, so that when something happens, we’re able to include that into a [breaking news] story.

Tell us about your Hack Day practice. What is the goal and how does it work?
Harjai: We take a survey before the Hack Day, and the survey usually has us indicate if there are any specific topics or projects that we are interested in participating in. For our last Hack Day, we ultimately chose three different projects, and the teams of people for each project were already settled because of responses to the survey. So I was interested in working on a project trying to figure out a way to help reporters see anomalies in [Mexican and Canadian] border wait times. Then we go into our own teams and decide: What can we accomplish in that day?
We continue working on the projects after Hack Day because they are useful, in a journalistic sense. But I think the benefit is the team building, team cohesion and approaching a challenge together.
Lurye: I will also point out that these hack days are completely remote, so I think that makes it even more impressive.
In addition to Hack Day, we have weekly learning time which is a block of time on our calendar when you’re not supposed to have any meetings that you can devote to a learning project. I started a learning project, where I wanted to experiment with building a scraper to scrape school board meetings. After I had done that, I pitched it for Hack Day to continue building on it, and then we worked on it a lot more during Hack Day. And then even beyond that, we still kept it up.
Wildeman: It’s really fun. It’s really important to the team cohesion because we’re so distributed. It just exposes you to the intellectual power of the team as a whole, so that’s really energizing and fun. We get one upside of a project sometimes coming out of it that we hope to put all the way through to publication or deployment, but we also just get to learn what the strengths of the other members of our team are and it empowers us about how much we can accomplish in a short period of time.
Do you have any advice for people applying for data reporting positions, generally across different newsrooms?
Wildeman: Editors are going to be most impressed by a really good pitch in my experience. So I would have at least a few really ambitious pitches, and bring those to the interview process because that’s the language the editors speak.
Lurye: I would also add it’s important to emphasize the core journalistic skills in addition to the data skills. So if you also have the journalism experience — you can write, you can interview and you understand what makes for a good news story — it’s really good to emphasize those kinds of skills.
Harjai: Data journalists have a lot of skills that they can contribute. And it doesn’t always have to be some big flashy map. When you’re making a portfolio, don’t feel like you need to have some crazy sort of interactive web page already built. There’s a lot of ways you can show that you’re a good data reporter.
Keller: Be thoughtful about communicating your process. Tools, languages and software — some fluency there is important — but it’s more [important to know] how you think, the way that you think about analyzing a data set, extracting the information and interviewing. It will translate across programming languages and tools.
Kelly Chan specializes in feature writing, digital marketing, photography and multimedia storytelling. She is a recent graduate of Northeastern University and is now pursuing a M.S. in Media Innovation and Data Communication there as well.
- Here are Nathan Griffiths’ takeaways from his career journey experimenting with different mediums - June 17, 2024
- Here’s a look inside the data team at the Associated Press - February 13, 2024
- How Alex Lim visualized the colors of Singapore for The Straits Times - September 28, 2023


