Six data stories about Boston from Northeastern’s Urban Tensions hackathon
All cities have conflict. There are tensions between police and underserved communities, landlords and tenants, low-income residents and wealthy gentrifiers, and so much more. Here in Boston there are residents who could tell you this, but there are statistics, too, including dropout rates from Boston Public Schools, MBTA commuter rail ridership, Boston homicide rates, and Zillow home prices.
But how can those data illustrate urban issues and be used to tell stories about Boston?
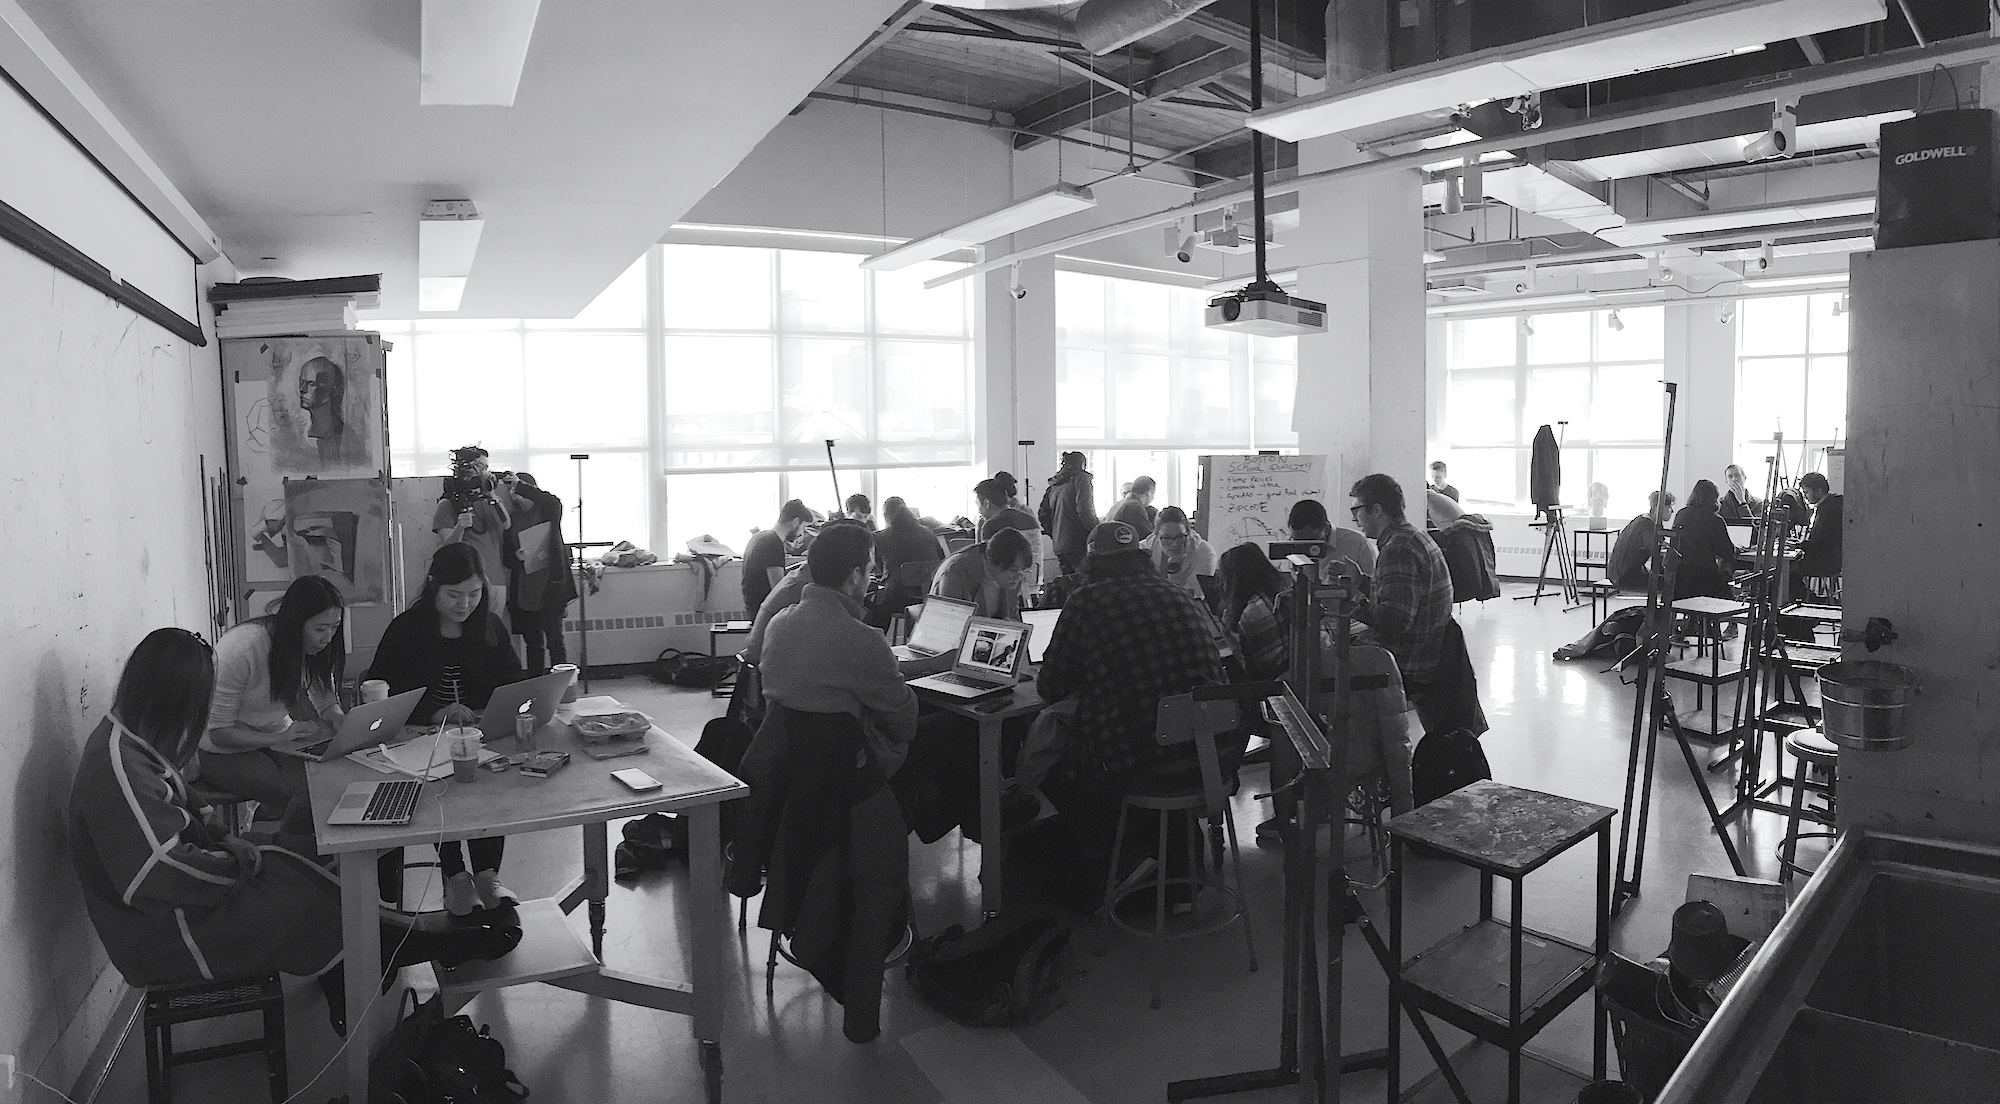
That was the central theme of “Urban Tensions,” a one-day hackathon hosted last Saturday by Northeastern University’s School of Journalism and the Information Design and Visualization program. Participants began the day with a series of inspiring lightning talks. Ben Green, a fellow at Harvard’s Berkman Klein Center for Internet and Society, spoke about Analyze Boston, a new open data portal which the City of Boston launched just days before the hackathon. Christine Dixon, deputy director of Project Hope in the Dudley Square area of Boston’s Roxbury neighborhood, described how her organization collected data on housing court cases over a number of years. (Hint: It was a tedious, grueling process.) And Wenfei Xu, a research associate at MIT’s Civic Data Design Lab, spoke about small and big data in the context of gentrification in Brooklyn as well as residential development in China.
https://vimeo.com/215052657
After pitches and team formation, participants were given around four hours, several datasets and pizza to come up with ideas on how to draw local stories from data. Some groups focused more strictly on research, while others came up with maps and interactive visualizations. Follow the tweets here and check out my Storify here. Below, some of the projects – and all four winners – that resulted from the afternoon.
Totaling bicycle and pedestrian accidents
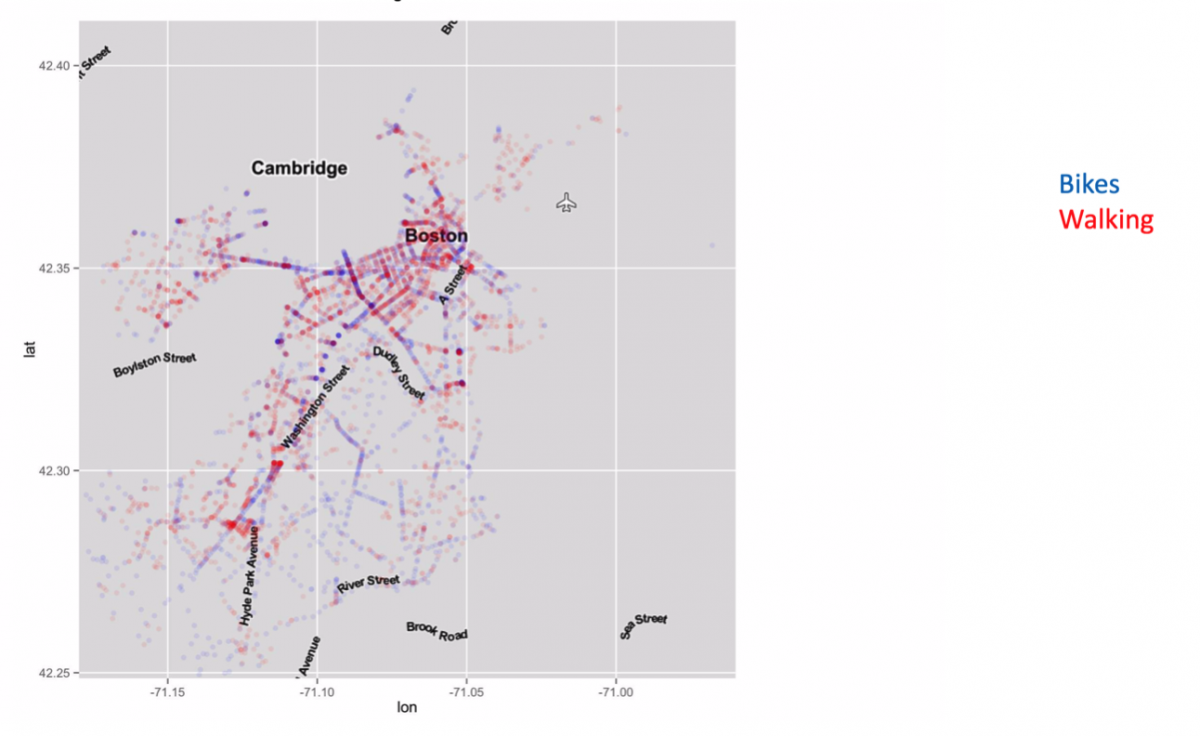
The idea: Determine Boston’s most dangerous neighborhoods in terms of traffic fatalities.
The data: Pedestrian and bicycle crashes from the City of Boston’s Vision Zero program.
The conclusion: More traffic fatalities seem to occur around job centers like Boston’s financial district. The city should perhaps target specific areas to improve traffic conditions and reduce accidents.
Examining how Boston’s housing crisis has developed
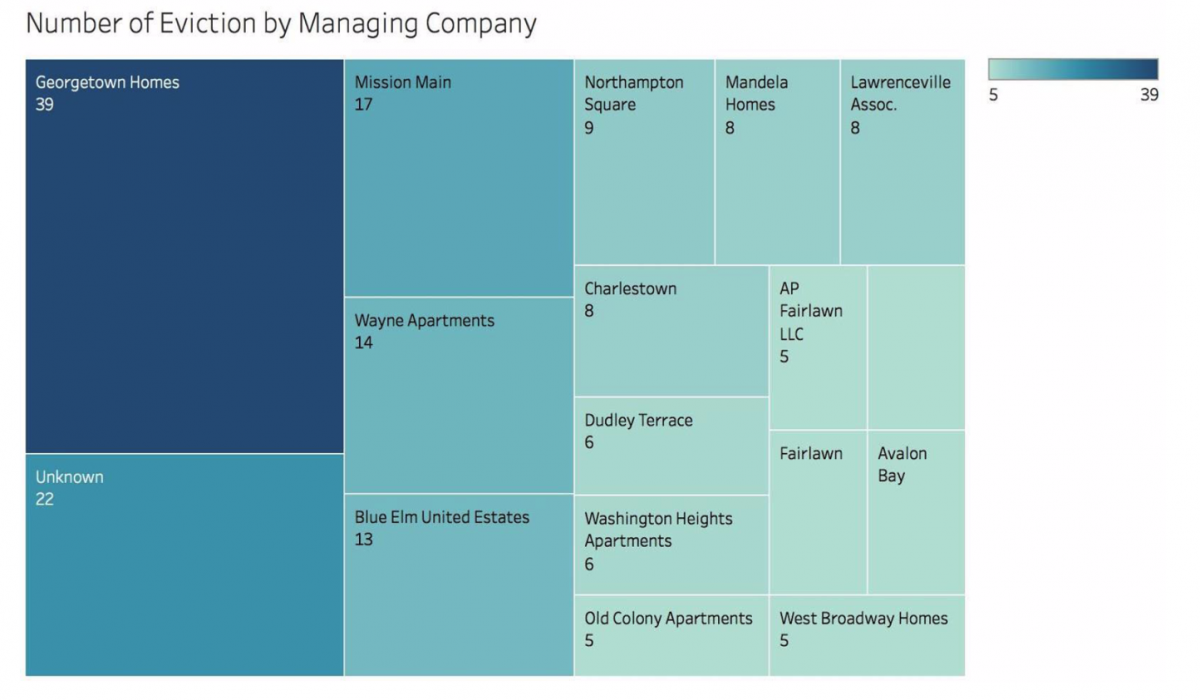
The idea: Determine which factors contribute to Boston’s housing crisis and how.
The data: Median home value over time by neighborhood, evictions broken down by management company, building permits by census tract as well as eviction data from Project Hope.
The conclusion: Many factors are at play, and there must be more transparency between housing services and their communities.
An empathy game to understand the decisions that lead to evictions
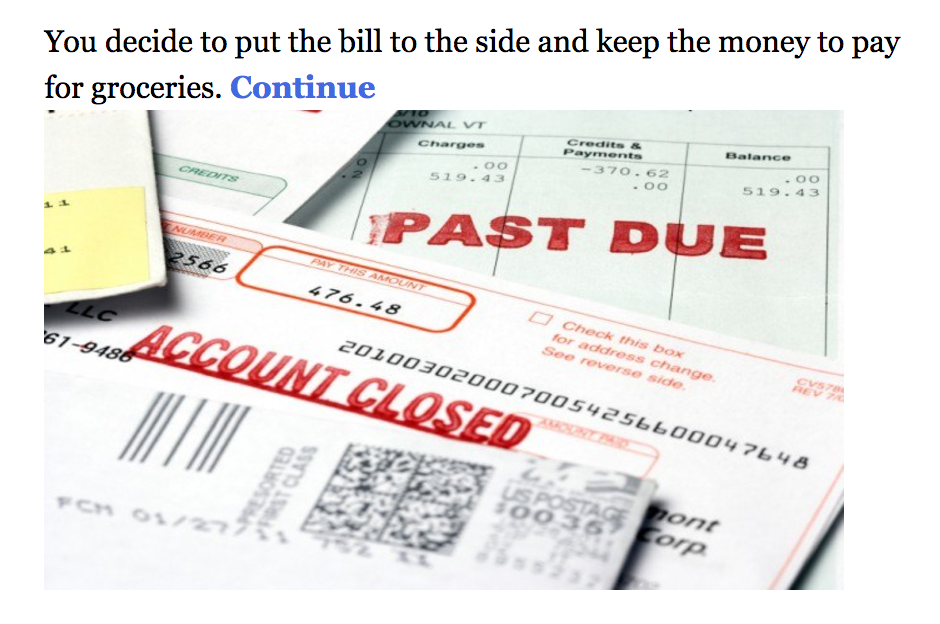
The idea: To build an empathy game to help users understand evictions.
The data: Housing a Changing City Boston 2030 report.
The conclusions: The decisions that ultimately result in a person being evicted can be understood by just about anyone that has ever faced mounting bills and a tenuous job market.
* This project won 4th place.
The effects of cutting weekend commuter rail service
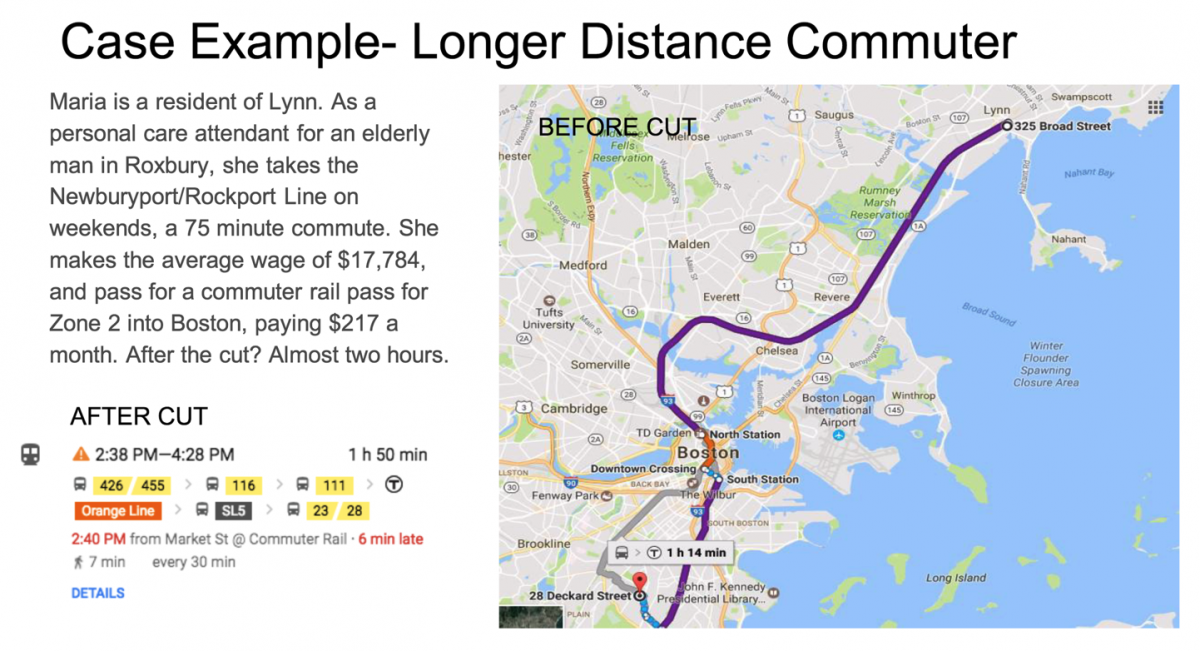
The idea: Examine how slashing MBTA weekend commuter rail service would impact individuals and towns.
The data: MBTA Blue Book, Mass.gov, Google Maps, 2016 Massachusetts Department of Aging data by geography, and the 2015 Focus 2040 Commuter Rail Investment Plan Data (25-year capital plan for MBTA).
The conclusion: Cutting weekend service would have an overall negative impact on commuters.
* This project won 3rd place.
Homicide data used to be much more colorful
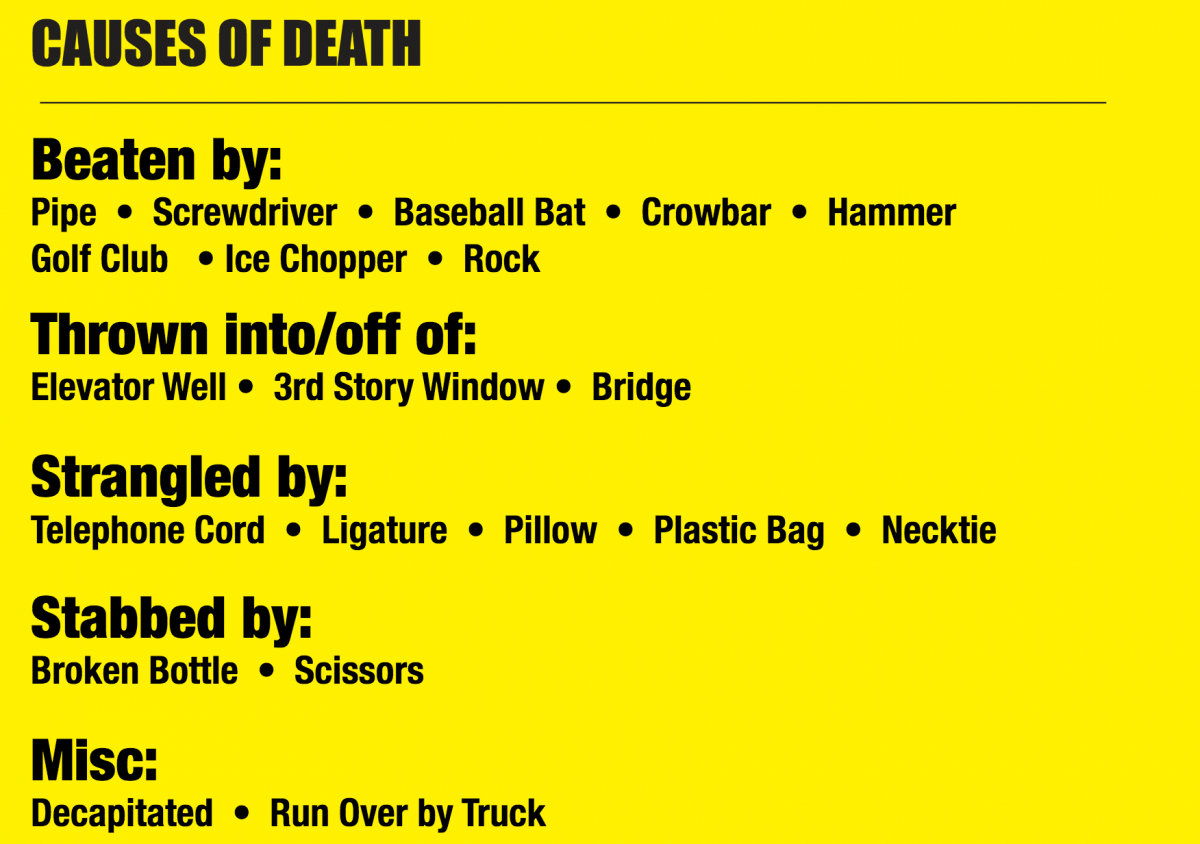
The idea: Sifting through Boston homicide data to look for trends in murder time and day of the week.
The data: Boston homicide data 1963–2015.
The conclusions: Fridays seemed to be the most murderous. The descriptions of murders on police reports used to be much more colorful.
* This project won 2nd place.
Cycling with Hubway offsets carbon emissions
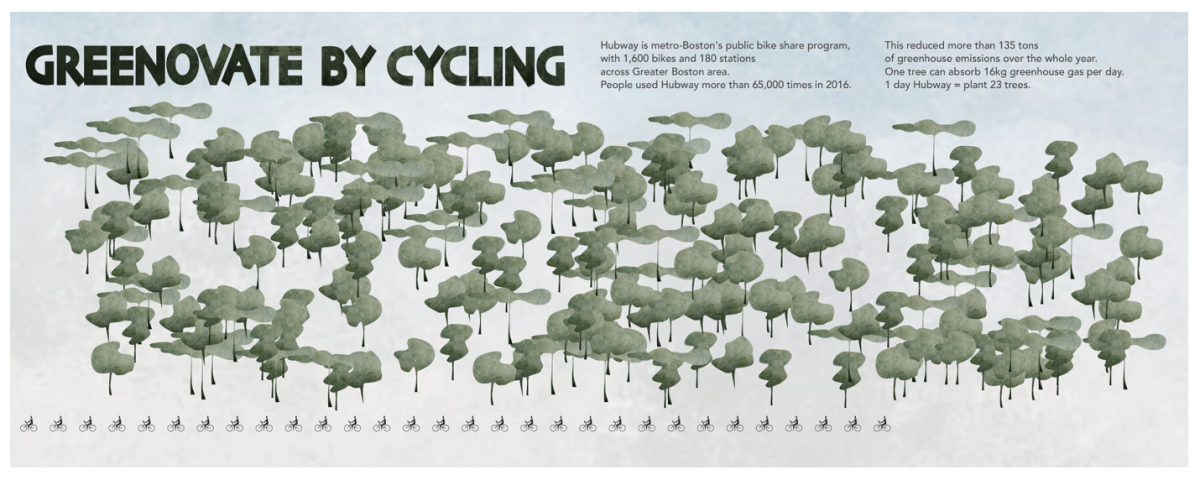
The idea: Estimate and illustrate how many emissions are offset by the Hubway bicycle sharing service.
The data: Hubway, Mass.gov and the U.S. Environmental Protection Agency.
The conclusion: Cyclists used Hubway more than 65,000 times last year. This collectively offset over 135 tons of carbon dioxide emissions which the group estimated as being the equivalent of planting more than 7,600 trees.
* This project won 1st place.
- Five major takeaways from the 2017 Online News Association conference - October 11, 2017
- Six data stories about Boston from Northeastern’s Urban Tensions hackathon - April 10, 2017
- Takeaways from Harvard’s Fake News Conference - March 8, 2017


