A roundup of visualizations of discrimination in the tech industry
Technology has allowed us to stay connected with people around the globe, across different demographics, and has driven us to seek wider and deeper connections. The tech industry is advancing at a breakneck pace as new technologies are rapidly produced and launched. But when it comes to diversifying the workplace, the industry doesn’t exactly move at the same speed.
Palantir, a data startup worth $20 billion, ended up having to pay $1.7 million for discriminating against Asian engineers. It’s far from the only company discriminating on the basis of gender, orientation or race. Storybench rounded up 10 visualizations of discrimination in the tech industry.
Link Humans’ Employer Brand Index
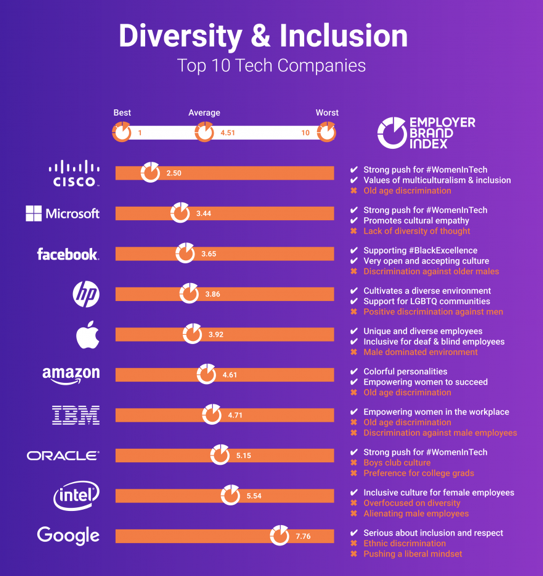
Link Humans used its Employer Brand Index methodology to score the top 10 tech companies on various forms of discrimination including gender, race and age. This visual illustrates how varied tech companies can be with their diversity and inclusion, and the different areas of diversity where a company is excelling and/or lacking. It is not enough for a company to produce good stats, but to also maintain an inclusive culture for all people of various demographics in the workplace. There is an expectation from the company to create a diverse workforce, but to also enforce and encourage their employees to sustain a positive and empathetic work culture and attitude. The following visuals will display the data illustrating the various forms of systematic discrimination in the tech industry.
Statista’s look at females in tech jobs
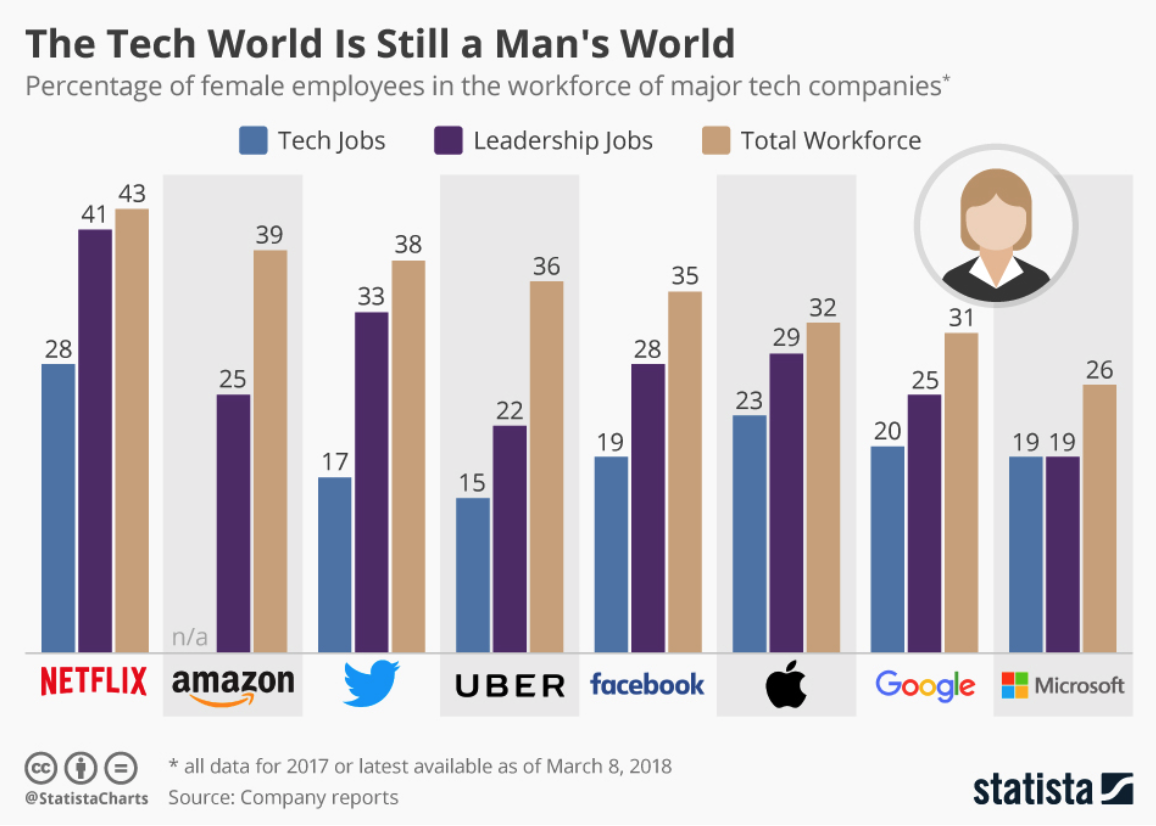
Statista used a grouped bar graph to demonstrate the proportions of women in tech jobs, leadership jobs, and in the workforce across several big tech companies. Although Netflix has a close proportion between women in leadership vs. women in the workforce, the proportion of women who have tech jobs is only a bit over a quarter, meaning men make up nearly 75 percent of tech jobs at Netflix. The other companies have larger disproportions between men and women making up the workforce, and even fewer women in tech. Only has 15 percent of women hold tech jobs within Uber, and 22 percent of women holding leadership roles, despite women making up 36 percent of the company’s total workforce. The disproportion of women across these fields leads to a lack of representation, heightened discrimination and can create a negative work environment.
Hired’s gender breakdown
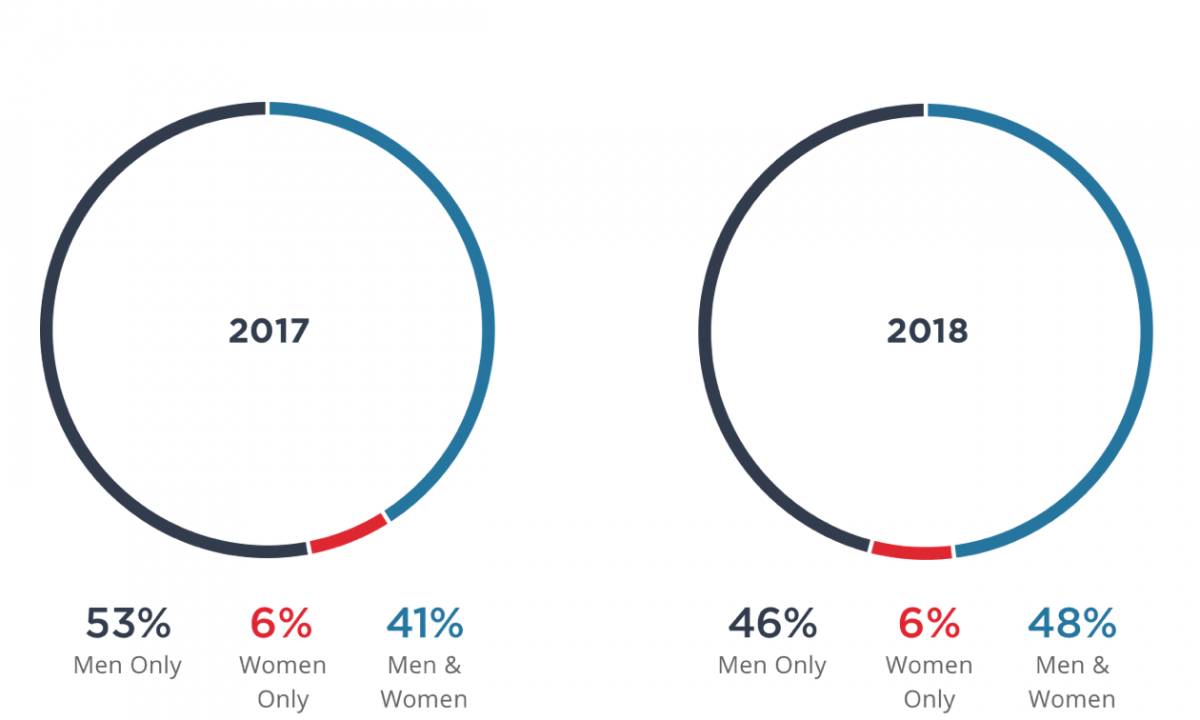
Hired gathered data on candidate proportions. The visual above uses a doughnut pie chart, with the year inside of the chart, and the proportion of the data on the ring of the chart. Here we can see the disproportion of men and women in tech even before entering the workplace. Though the distributions have improved slightly from 2017, men still make up an overwhelming proportion in candidate pools. One may also wonder what the further proportions would be in the “Men & Women” category, but one may infer it’s not so different from the proportions shown above. The “Women Only” category is also interesting because of how it stayed consistent between the two years. Perhaps looking into the candidate positions in comparison to its gender distribution will give us more information on why these spaces exist. Although this seems preliminary, this data has affected potential hiring methods. Amazon wanted to bring automation into the hiring process by working on a machine-learning artificial intelligence that would choose the best candidates from a pool―except it showed a clear bias toward women, due to the pattern of men dominating the tech industry shown from the data.
Wage and expectation gaps for women by U.S. city
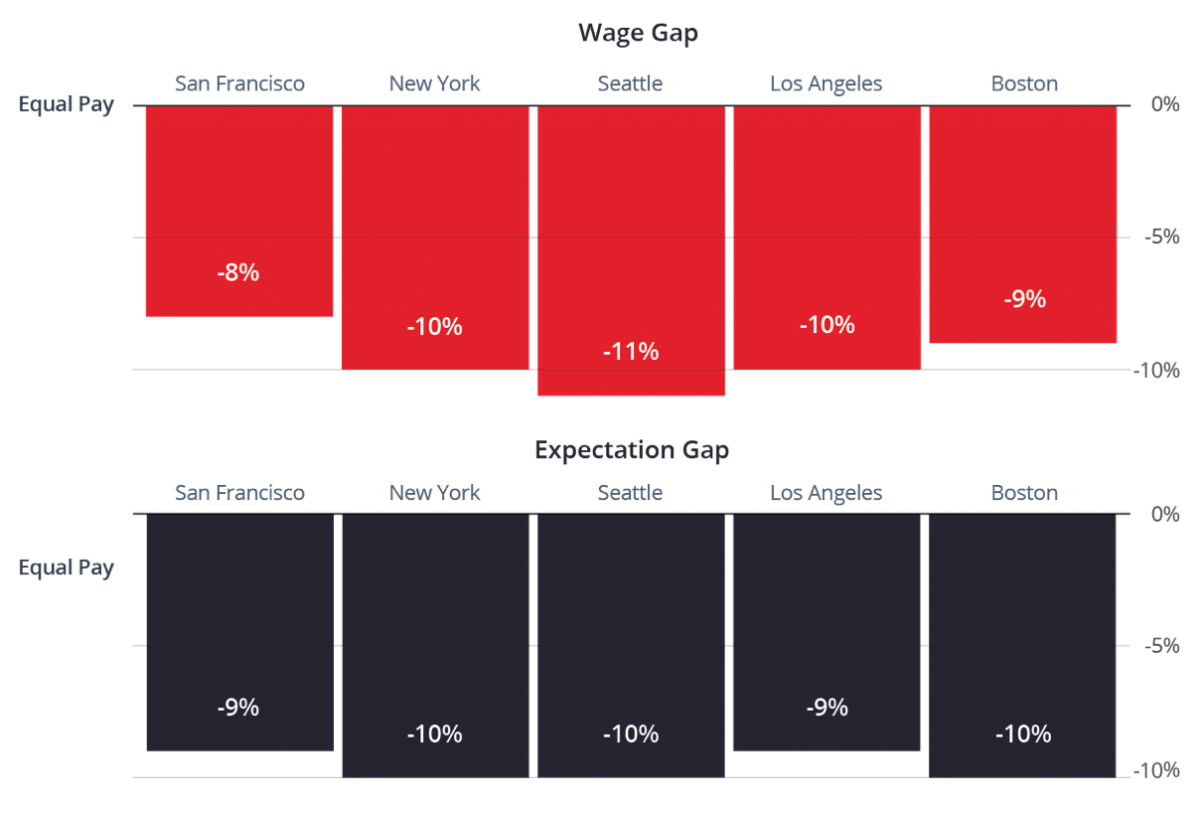
Sticking with Hired, it also visualized the wage gap between men and women in tech by location. San Francisco, New York, Seattle, Los Angeles and Boston are all cities that are hubs for the tech industry. Despite numerous accounts of sexual harassment and lack of diversity in Silicon Valley, it appears to be leading in closing the wage disparity between men and women. Hired also chose to compare this data to the expectation gap, which represents the proportion of what women are expecting to be paid. The wage and expectation proportions are very similar, which brings up the question, “Do they know they are being paid less than their male-counterparts?”
People of color rare in Silicon Valley management
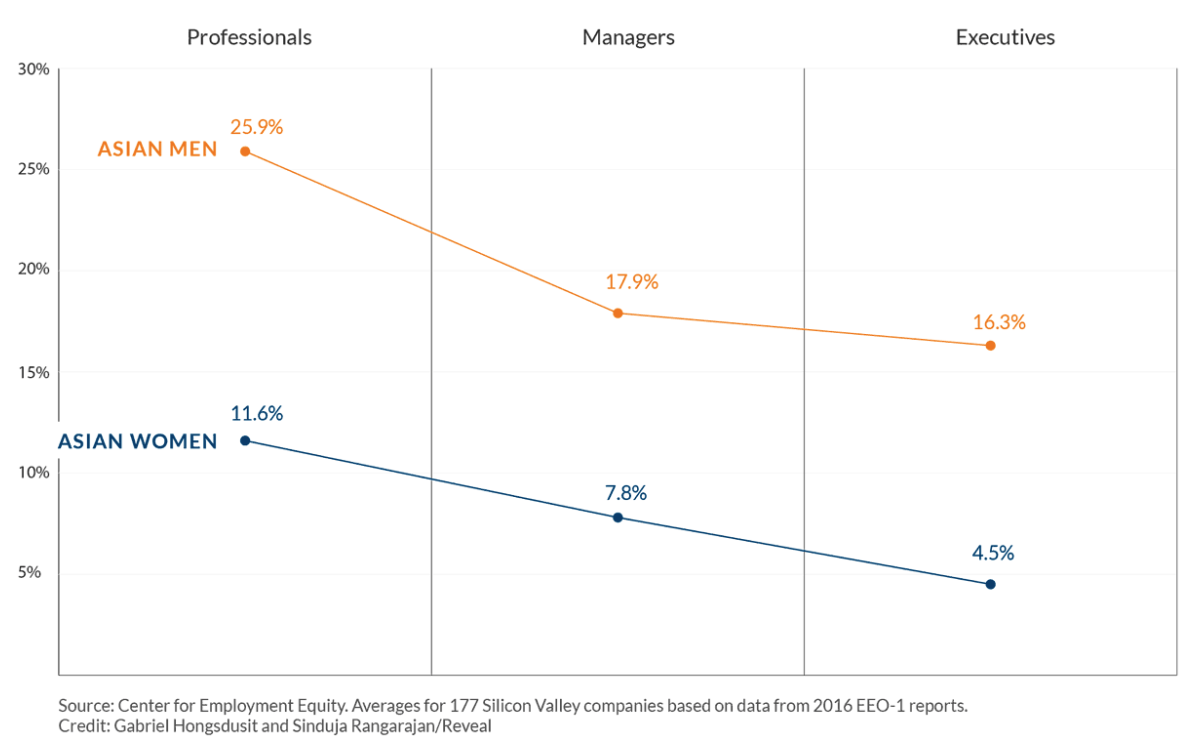
Reveal produced numerous visualizations in order to illustrate a clear picture of diversity in Silicon Valley. The graph above is a series of line graphs that compare men and women within different racial demographics in terms of representation across different levels. It’s important to note that the graph represents only people of color in Silicon Valley, and that demographic alone scales the graph up to 30 percent, and we see that the largest proportion is only 25.9 percent. In each case, women have a lower proportion compared to men, especially as the level of leadership increases. It is also important to realize that each line graph possesses a negative slope, meaning fewer and fewer minorities are rising up the ranks within the company. It is important to note the drastic change in slope for Asian men between professionals and managers. This shows that even though a company may possess good statistics on diversity in the workplace, they don’t possess representation of those diverse peoples at the executive levels.
Exploring computer science majors
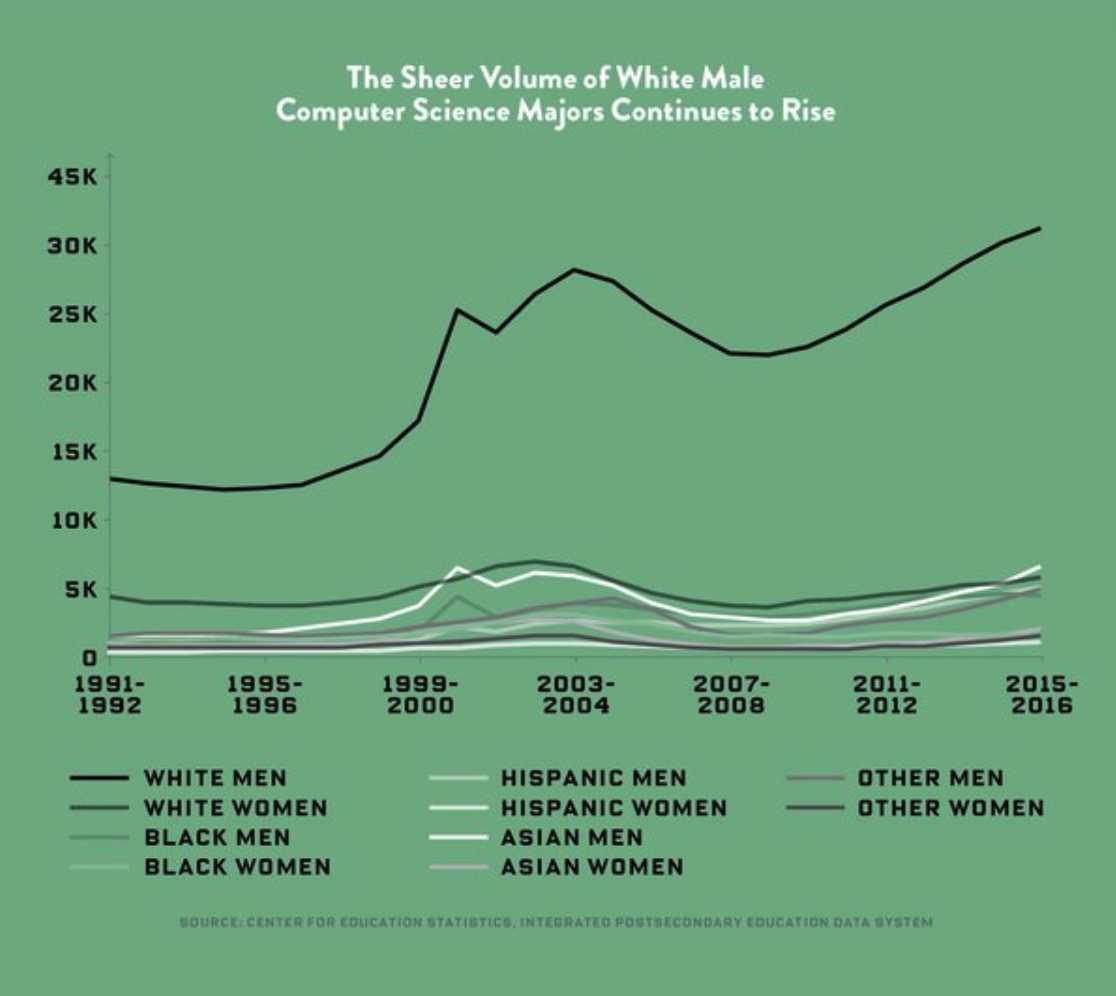
Wired decided to take a step back from the workplace and to evaluate the data on computer science majors over the years. In the two visuals above, one uses a line graph and the other uses a stacked bar graph. The line graph better illustrates the huge difference in the number of white males compared to women and men of other races, while the stacked bar graph better illustrates the proportions amongst all of these demographics. In either graph, we see that white men have dominated this field since the 1990s. This is not because all other people of different backgrounds and demographics are fall less interested in the field, however, but because of recruitment and language. As mentioned in the article, “Stanford researchers observed more than 75 recruiting sessions held by more than 60 companies and identified countless seemingly obvious ways the recruiters might be alienating female recruits, from sexist jokes to presentations displaying only slides of men.” If inclusivity is not present at the recruitment stage, then representation and diversity will continue to suffer through the hiring process, in the workplace and rising through the ranks at a company. A simple way to make a space more inclusive is through language. Wired also mentioned “The Braid Initiative” — with help from the likes of Facebook, Microsoft and Harvey Mudd College — which has been making a concerted effort to change this by encouraging universities to modify their introductory CS courses. The effects are promising. When University of California-Berkeley changed the title of its introductory computer science for non-majors to ‘The Beauty and the Joy of Computing,’ female enrollees outnumbered male ones for the first time ever.
As a non-white woman going into the tech industry, it was a bit discouraging looking at the data. However, there are many organizations whose mission is to create diversity and inclusion in the tech industry. Some include:
- Girls Who Code: A non-profit organization whose mission is to support and increase the number of women in computer science.
- Women Who Code: An international non-profit organization whose mission is to provide services for women pursuing technology careers and a job board for companies seeking coding professionals.
- #YesWeCode: “A Dream Corps initiative that works with partners to help connect 100,000 underrepresented minorities to careers in technology.”
- We Can Code IT: “Teaches people how to code, with a special emphasis on inclusion and diversity in tech. We bridge the gap for those underrepresented in tech, the same groups susceptible to low to moderate incomes, through education in software engineering and web development.”
- Code.org: “A non-profit dedicated to expanding access to computer science, and increasing participation by women and underrepresented students of color. Our vision is that every student in every school should have the opportunity to learn computer science. We believe computer science should be part of core curriculum, alongside other courses such as biology, chemistry or algebra.”
As these organizations push to make tech a more inclusive space and accessible to everyone, the industry itself must recognize all of the people it serves and is made up by. While most of the data looks at gender and race within the tech industry, it is also important to be aware of the LBGTQ+ community, neurodiversity and people with disabilities. As the tech industry continues to grow and shape each generation, it must also strive for inclusivity and diversity.
Websites with interactive data:
- Here’s the clearest picture of Silicon Valley’s diversity yet: It’s bad. But some companies are doing less bad
- Diversity in Tech
- How do tech’s biggest companies compare on diversity?: The tech diversity scorecard
Articles about the LGBTQ+ community in tech:
- Research being done on the data of queer people in stem
- When it comes to tech, lesbians want to ‘reclaim the space’
- Is Science Too Straight?
- Out in Tech: What it’s like to be LGBT in an industry struggling with diversity
Articles about neurodiversity and people with disabilities in tech:
- Why the tech industry needs people with disabilities — and vice versa
- The Power of Disability Inclusion in the Technology and Entrepreneurial Sector
- Why More Tech Companies Should Hire People With Disabilities
- How employees with disabilities can fill tech skills gaps and drive innovation
- Tech companies don’t want to talk about the lack of disability diversity reporting
- Accenture, EY, Google, Microsoft And Other Leaders Find Great Value In Employees With Disabilities
- A roundup of visualizations of discrimination in the tech industry - December 18, 2018
- Some not-so-obvious ways to represent voter turnout data - October 19, 2018