Building Your First Interactive Map with Leaflet.js
Maps are one of the most powerful tools in our storytelling toolbox. They can illustrate where an event happened, how resources are distributed across a city, and even plot where your favorite coffee shops cluster in your neighborhood of interest. Maps allow readers to not just read stories–but explore them.
The good news: you don’t need to be a GIS expert to make an incredible map. With Leaflet.js, a free and lightweight JavaScript library, you can build an interactive map with just a few lines of code. (If you’re new to use code for mapping, you may want to check out our beginner’s guide to GeoJSON).
In this tutorial, we’ll create a simple map step by step: placing markers, styling them, and mapping multiple locations at once. At the end, we’ll also show how these same techniques can connect to practical, live, real-world data — like Boston’s MBTA train tracker.
💡 Pro tip: We’ll be writing our code in Visual Studio Code (VS Code), a free and widely used text editor. You can safely use it for HTML, CSS, JavaScript, and beyond. It’s reliable for beginners and professionals alike.
1. Setup: Choose Your Code Editor
While we’ll show examples using Visual Studio Code (VS Code) for its helpful features like Live Server, you can use any code editor that lets you create and preview HTML files—Sublime Text, Atom, Notepad++, or even a basic text editor. The code works exactly the same everywhere.
Option A: Using VS Code with Live Server (Recommended for beginners)
- Open VS Code
- Create a new folder named leaflet-map
- Install the Live Server extension (by Ritwick Dey)
- Right-click index.html and choose “Open with Live Server”
Option B: Using Any Other Editor
- Create a folder named leaflet-map anywhere on your computer
- Create the three files listed below using your preferred editor
- Open index.html directly in your browser by double-clicking it
Create these three files in your “leaflet-map” folder :
- index.html
- style.css
- script.js
2. Create a Basic Leaflet map with HTML and CSS
Open the index.html doc you just created and enter the code below. It links Leaflet from a CDN, pulls in your CSS and JS, and includes a div with a fixed height so the map is visible.
<!DOCTYPE html>
<html lang="en">

<head>
    <meta charset="UTF-8">
    <meta name="viewport" content="width=device-width, initial-scale=1.0">
    <title>My Leaflet Map</title>
    <!-- Leaflet CSS -->
    <link rel="stylesheet" href="https://unpkg.com/leaflet@1.9.4/dist/leaflet.css" />

    <!-- Our custom CSS -->
    <link rel="stylesheet" href="style.css">
</head>

<body>
    <!-- Map container -->
    <div id="map"></div>
    <!-- Leaflet JavaScript -->
    <script src="https://unpkg.com/leaflet@1.9.4/dist/leaflet.js"></script>
    <!-- Our custom JavaScript -->
    <script src="script.js"></script>

</body>
</html>
Next, open the style.css doc you created and add this codewhich will ensure that the map is visible by defining a div height.
/* Give the map a visible height - no height = invisible map! */
#map {
    height: 600px;
    width: 100%;
}

body {
    margin: 0;
    padding: 0;
    font-family: Arial, sans-serif;
}
Now, let’s move to where the action happens — in JavaScript. Open the script.js doc you created and add this code to call a map of Boston as our base map. We’ll use the latitude and longitude of Boston to make sure our map centers on the city.
// Wait for the page to load before initializing the map
document.addEventListener('DOMContentLoaded', function () {
// Initialize the map centered on Boston
const map = L.map('map').setView([42.3601, -71.0589], 13);
// Add the base map tiles (OpenStreetMap)
L.tileLayer('https://{s}.tile.openstreetmap.org/{z}/{x}/{y}.png', {
attribution: '© OpenStreetMap contributors'
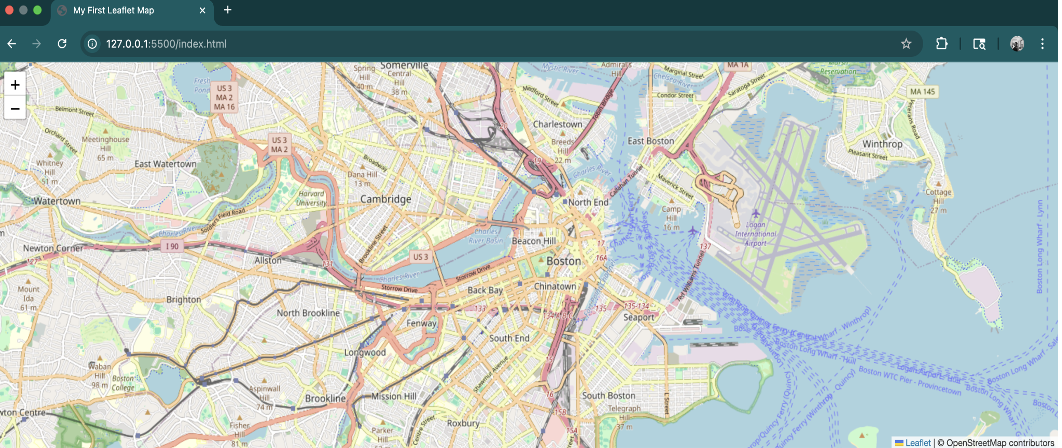
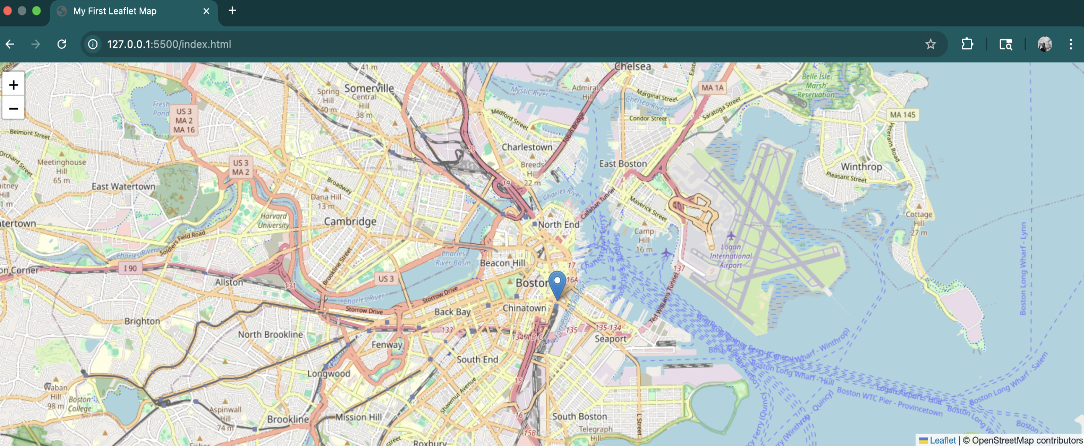
}).addTo(map);Open the site with Live Server or whatever preview your code editor provides.
If you still see a blank page:
• Open the browser Console (Right-click → Inspect → Console) to check for red errors.
• Confirm #map exists and has height in Elements and Styles.
• Make sure the Leaflet CSS/JS URLs are correct and not blocked by an extension or a firewall. This is how the map should look.
3. Add your first marker
Append this to script.js inside the DOMContentLoaded callback, after the tile layer:
// 1) A single default pin marker
  L.marker([42.3523, -71.0550]).addTo(map).bindPopup("South Station");
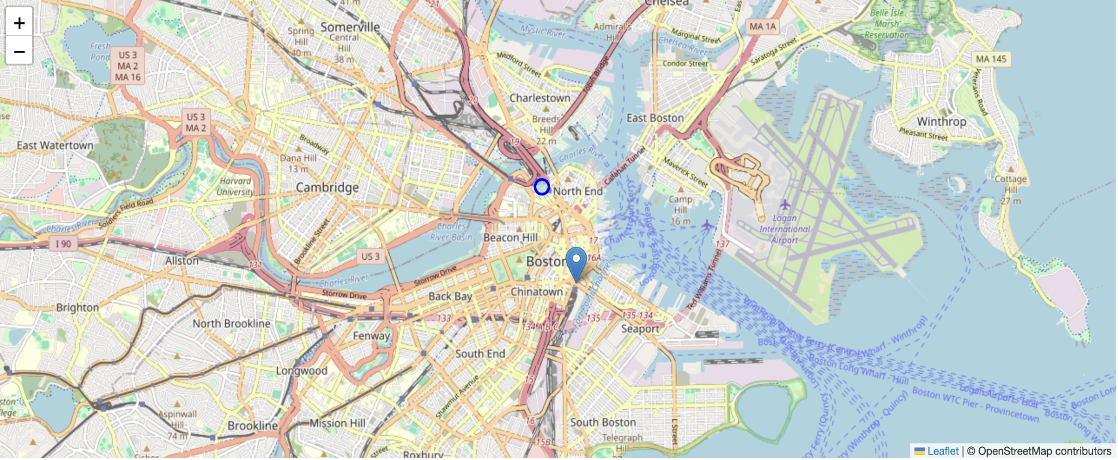
Here’s how it should look when you preview it with Live Server:
4. Customizing your markers
Next, add a styled circle marker to the script.js code. This helps readability when you have many points.
 // 2) The styled circle marker (thin blue ring)
  L.circleMarker([42.3656, -71.0616], {
    radius: 7,          // size of the circle
    color: "blue",      // outline color
    weight: 3,          // outline thickness
    fillColor: "lightblue",
    fillOpacity: 0.25   // light fill; set to 0 for a hollow ring
  })
  .addTo(map)
  .bindPopup("North Station");
📸 Previewing it now, you see a blue circle at North Station.
5. Plot multiple locations from data
Replace hard-coded markers with a loop. Put this below the previous markers:
// Define multiple locations
 const locations = [
    { name: "Downtown Crossing", lat: 42.3555, lon: -71.0600 },
    { name: "Harvard Square",    lat: 42.3733, lon: -71.1189 },
    { name: "Park Street",       lat: 42.3563, lon: -71.0624 }
  ];

// 4) Add markers for each location
  locations.forEach(loc => {
    L.marker([loc.lat, loc.lon])
      .addTo(map)
      .bindPopup(loc.name);
  });
});
Here’s the complete script.js code:
document.addEventListener('DOMContentLoaded', function () {
  // Initialize the map centered on Boston
  const map = L.map('map').setView([42.3601, -71.0589], 13);

  // Add the base map tiles (OpenStreetMap)
  L.tileLayer('https://{s}.tile.openstreetmap.org/{z}/{x}/{y}.png', {
    attribution: '© OpenStreetMap contributors'
  }).addTo(map);

  // 1) A single default pin marker (looks like the screenshot)
  L.marker([42.3523, -71.0550]).addTo(map).bindPopup("South Station");

  // 2) The styled circle marker (thin blue ring like in the image)
  L.circleMarker([42.3656, -71.0616], {
    radius: 7,          // size of the circle
    color: "blue",      // outline color
    weight: 3,          // outline thickness
    fillColor: "lightblue",
    fillOpacity: 0.25   // light fill; set to 0 for a hollow ring
  })
  .addTo(map)
  .bindPopup("North Station");

  // 3) Other locations as default **pin** markers
  const locations = [
    { name: "Downtown Crossing", lat: 42.3555, lon: -71.0600 },
    { name: "Harvard Square",    lat: 42.3733, lon: -71.1189 },
    { name: "Park Street",       lat: 42.3563, lon: -71.0624 }
  ];
// 4) Add markers for each location
  locations.forEach(loc => {
    L.marker([loc.lat, loc.lon])
      .addTo(map)
      .bindPopup(loc.name);
  });
});
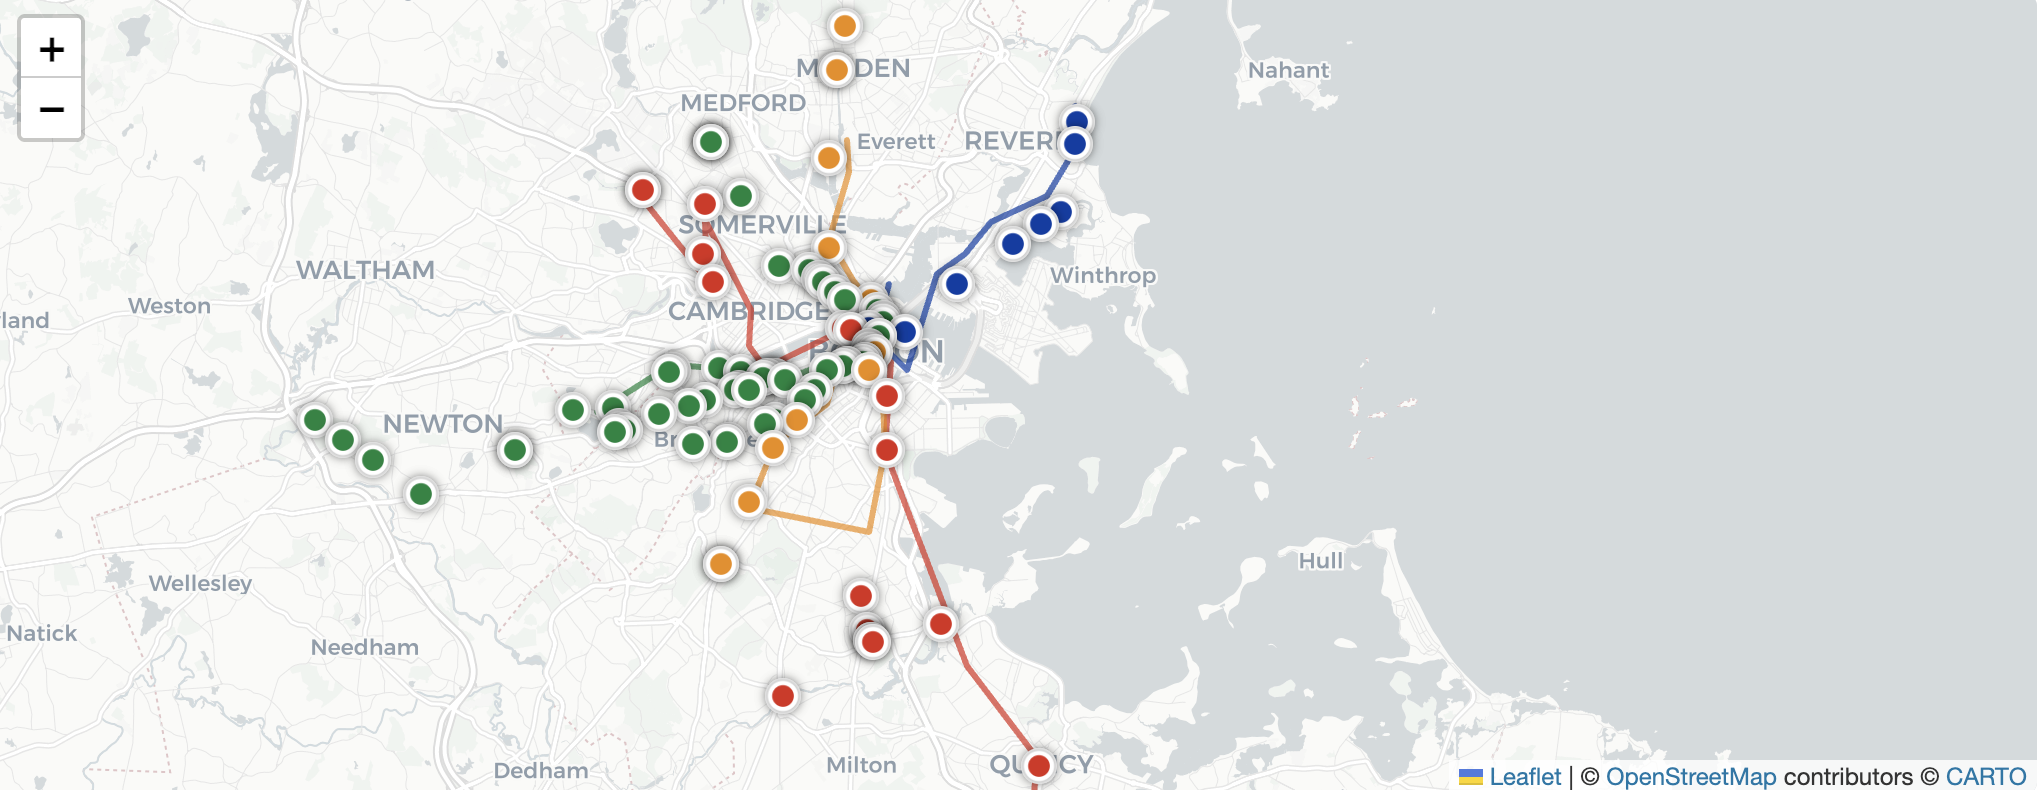
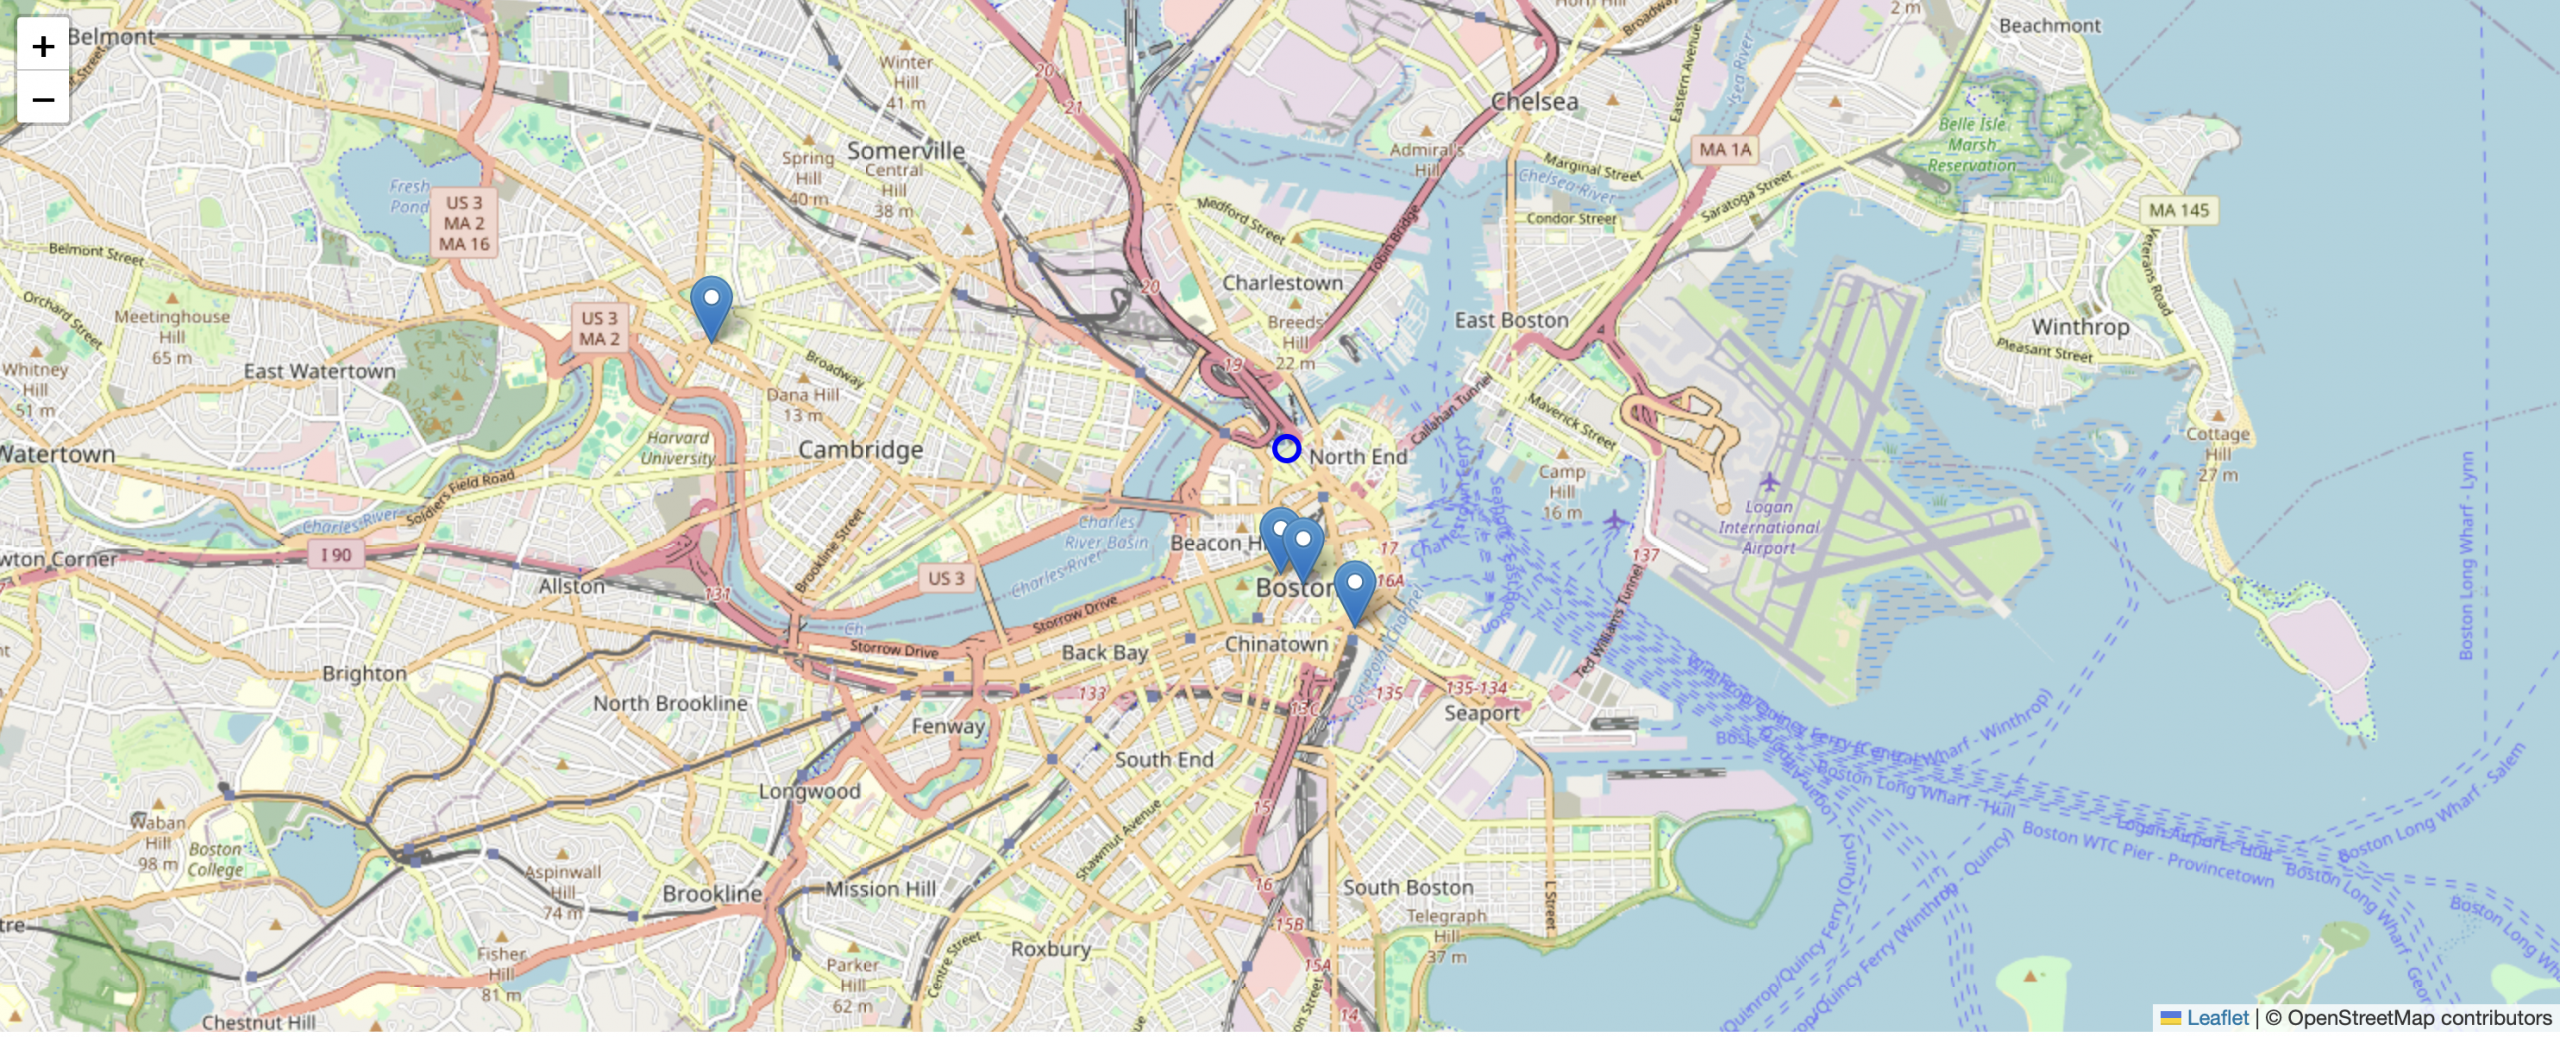
📸 Here’s how it should look:
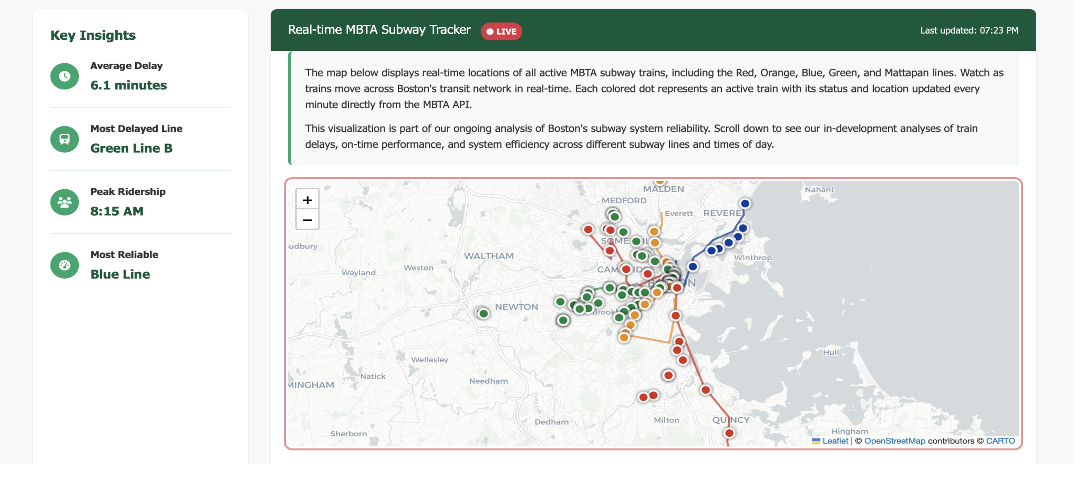
The Cool Part: Connect to Live MBTA Train Data
Now let’s make this map come alive with real-time train positions! The MBTA provides a free API that updates train locations every few seconds.
document.addEventListener('DOMContentLoaded', function () {
  /*******************
   * Map & base layer
   *******************/
  const map = L.map('map').setView([42.3601, -71.0589], 12);

  L.tileLayer('https://{s}.tile.openstreetmap.org/{z}/{x}/{y}.png', {
    attribution: '© OpenStreetMap contributors'
  }).addTo(map);

  /*************************
   * MBTA live train markers
   *************************/
  let trainMarkers = {};

  // MBTA official colors (with Green branches separated)
  const lineColors = {
    Red: '#DA291C',
    Orange: '#ED8B00',
    Blue: '#003DA5',
    'Green-B': '#00843D',
    'Green-C': '#00843D',
    'Green-D': '#00843D',
    'Green-E': '#00843D'
  };

  // Format route IDs into labels (Green-B → Green B)
  const routeLabel = (id) => (id ? id.replace('-', ' ') : 'Unknown');

  // Custom train icon (colored circle)
  function createTrainIcon(color) {
    return L.divIcon({
      className: 'train-icon',
      html: `<div style="
        background-color:${color};
        width:12px;height:12px;border-radius:50%;
        border:2px solid white;box-shadow:0 2px 4px rgba(0,0,0,.4);
      "></div>`,
      iconSize: [16, 16],
      iconAnchor: [8, 8]
    });
  }

  // Fetch and update MBTA train positions
  async function updateTrainPositions() {
    try {
      const url = 'https://api-v3.mbta.com/vehicles?filter[route_type]=0,1&include=route,stop';
      const resp = await fetch(url);
      const json = await resp.json();

      // Build stop lookup
      const stopNameById = {};
      if (Array.isArray(json.included)) {
        json.included.forEach(item => {
          if (item.type === 'stop') {
            stopNameById[item.id] = item.attributes?.name || '';
          }
        });
      }

      // Remove old markers
      Object.values(trainMarkers).forEach(m => m.remove());
      trainMarkers = {};

      // Add train markers
      (json.data || []).forEach(v => {
        const lat = v?.attributes?.latitude;
        const lon = v?.attributes?.longitude;
        if (lat == null || lon == null) return;

        const routeId = v?.relationships?.route?.data?.id || 'Unknown';
        const color = lineColors[routeId] || '#666';
        const dir = v?.attributes?.direction_id === 0 ? 'Outbound' : 'Inbound';
        const status = v?.attributes?.current_status || 'In Transit';

        const speedMps = v?.attributes?.speed;
        const speedMph = (typeof speedMps === 'number') ? Math.round(speedMps * 2.237) : '—';

        const stopId = v?.relationships?.stop?.data?.id || null;
        const stopName = stopId && stopNameById[stopId] ? stopNameById[stopId] : '';

        const atText = (status === 'STOPPED_AT' && stopName) ? ` at <em>${stopName}</em>` : '';

        const popupHtml = `
          <strong>Line:</strong> ${routeLabel(routeId)}<br>
          <strong>Direction:</strong> ${dir}<br>
          <strong>Status:</strong> ${status}${atText}<br>
          <strong>Speed:</strong> ${speedMph} mph
        `;

        const marker = L.marker([lat, lon], { icon: createTrainIcon(color) })
          .bindPopup(popupHtml)
          .addTo(map);

        trainMarkers[v.id] = marker;
      });

      console.log('Trains updated:', Object.keys(trainMarkers).length);
    } catch (e) {
      console.error('Error fetching MBTA vehicles:', e);
    }
  }

  // Initial load + refresh every 10s
  updateTrainPositions();
  setInterval(updateTrainPositions, 10000);

  /*********
   * Legend
   *********/
  const legend = L.control({ position: 'bottomright' });
  legend.onAdd = function () {
    const div = L.DomUtil.create('div', 'legend');
    div.innerHTML = '<h4>MBTA Lines</h4>';
    Object.entries(lineColors).forEach(([id, color]) => {
      div.innerHTML += `
        <div style="margin:5px 0;">
          <span style="
            display:inline-block;width:12px;height:12px;margin-right:6px;
            background:${color};border-radius:50%;border:1px solid #fff;
            box-shadow:0 1px 2px rgba(0,0,0,.2);
          "></span>${routeLabel(id)}
        </div>`;
    });
    return div;
  };
  legend.addTo(map);
});
How the Live Data Connection Works
Here’s the magic behind connecting to MBTA’s real-time data:
- API Endpoint: We use https://api-v3.mbta.com/vehicles which provides current positions of all trains
- Fetch Request: JavaScript’s fetch() gets the latest data
- Update Loop: setInterval() refreshes positions every 10 seconds
- Dynamic Markers: Old markers are removed and new ones added with current positions
- Visual Feedback: Each train shows as a colored dot matching its line color
Troubleshooting Guide
Common Issues and Solutions:
Blank page:
- Check that the #map div has height in your CSS
- Open browser console (F12) to check for errors
- Verify all file names match exactly
“L is not defined” error:
- Ensure Leaflet JS loads before your script.js
- Check that the CDN URLs are accessible
No trains appearing:
- MBTA trains don’t run 24/7 – try during Boston daytime hours
- Check browser console for API errors
- Some browsers block mixed content – ensure you’re using HTTPS
Tiles not loading:
- Check your internet connection
- Try a different tile provider like CartoDB:
L.tileLayer('https://{s}.basemaps.cartocdn.com/light_all/{z}/{x}/{y}.png')Where to Go Next
Now that you’ve built a live train tracker, consider these enhancements:
- Add station markers with arrival predictions
- Filter by line using layer controls
- Show train routes with polylines
- Add alerts for delays or service disruptions
- Create a dashboard with train counts and statistics
- Use WebSockets for truly real-time updates
The same pattern works for other transit APIs (NYC subway, Chicago CTA), bike-share systems, or any real-time location data.
Resources
📍 You’ve just built a real-time transit tracker! The same techniques can map anything from food trucks to earthquake data. What will you track next?

- Why Everything Feels Harder Now: The Hidden Cost of Efficiency - March 3, 2026
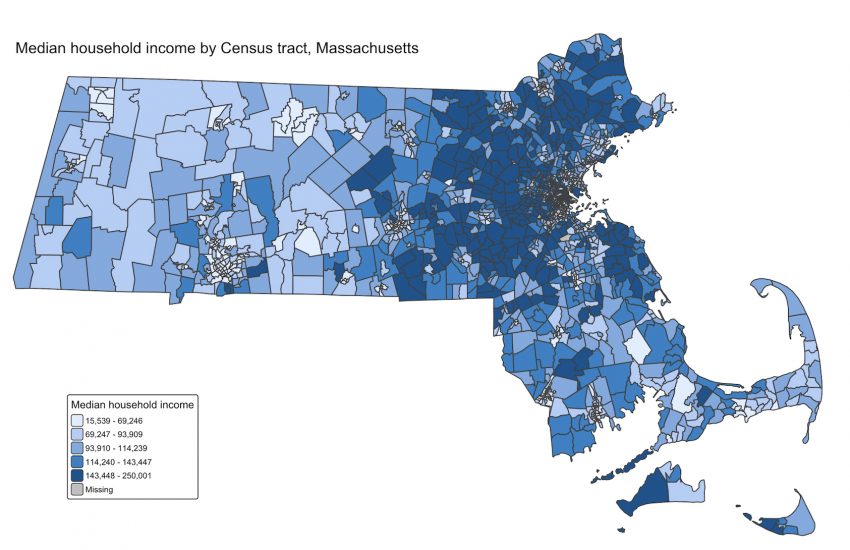
- Build a Census Tract-Level Map with R in Just 10 Minutes - February 17, 2026
- Building Your First Interactive Map with Leaflet.js - October 21, 2025