How the Tampa Bay Times visualized the racial breakdown of police shootings in Florida
Earlier this year, Neil Bedi, a reporter and developer on the Tampa Bay Times’ data and investigations team, produced “If You’re Black,” an interactive story exploring more than 800 officer-involved shootings that occurred in Florida between 2009 and 2014. The piece was part of a larger project named “Why Cops Shoot.”
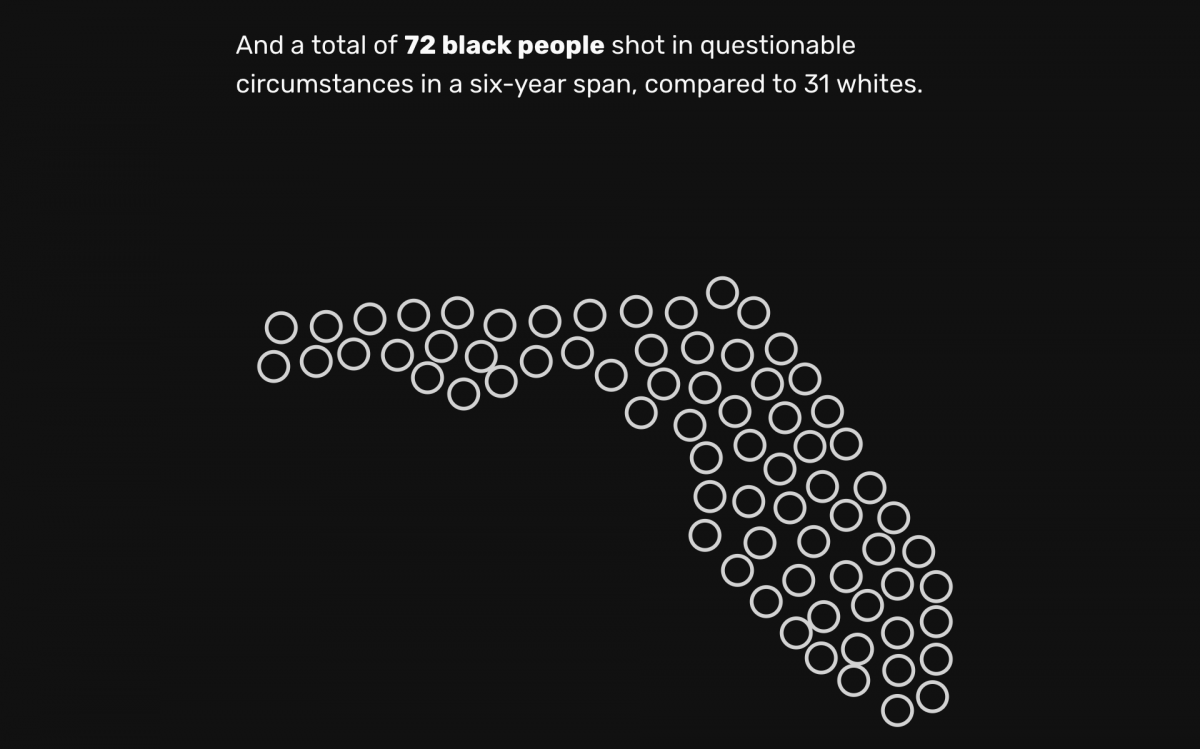
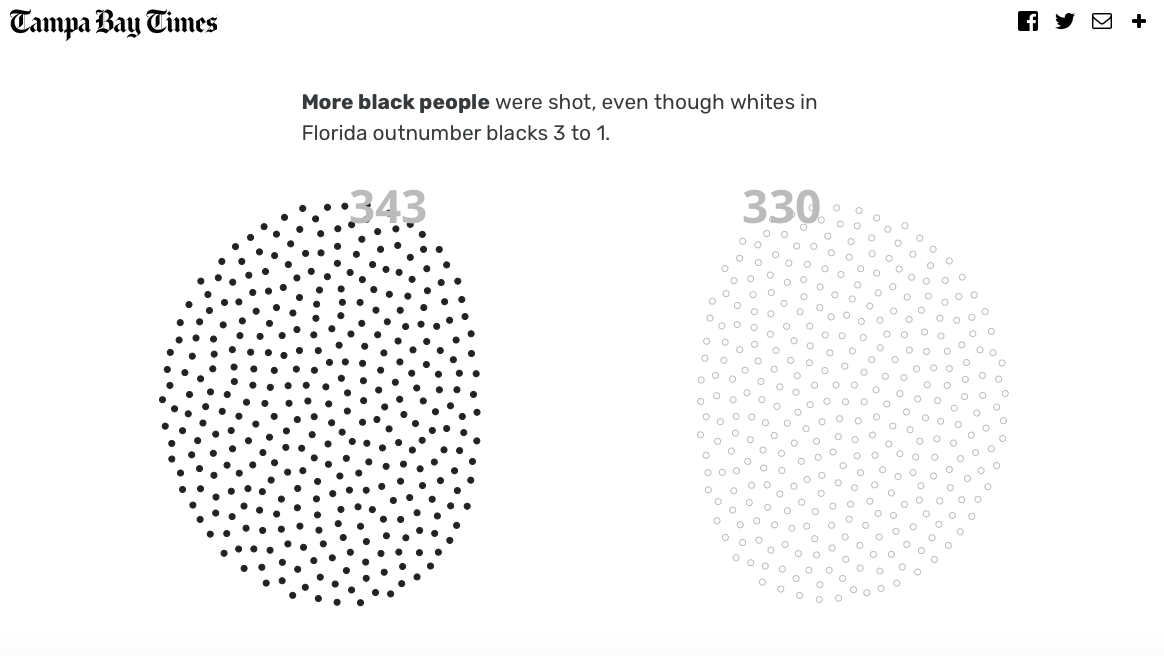
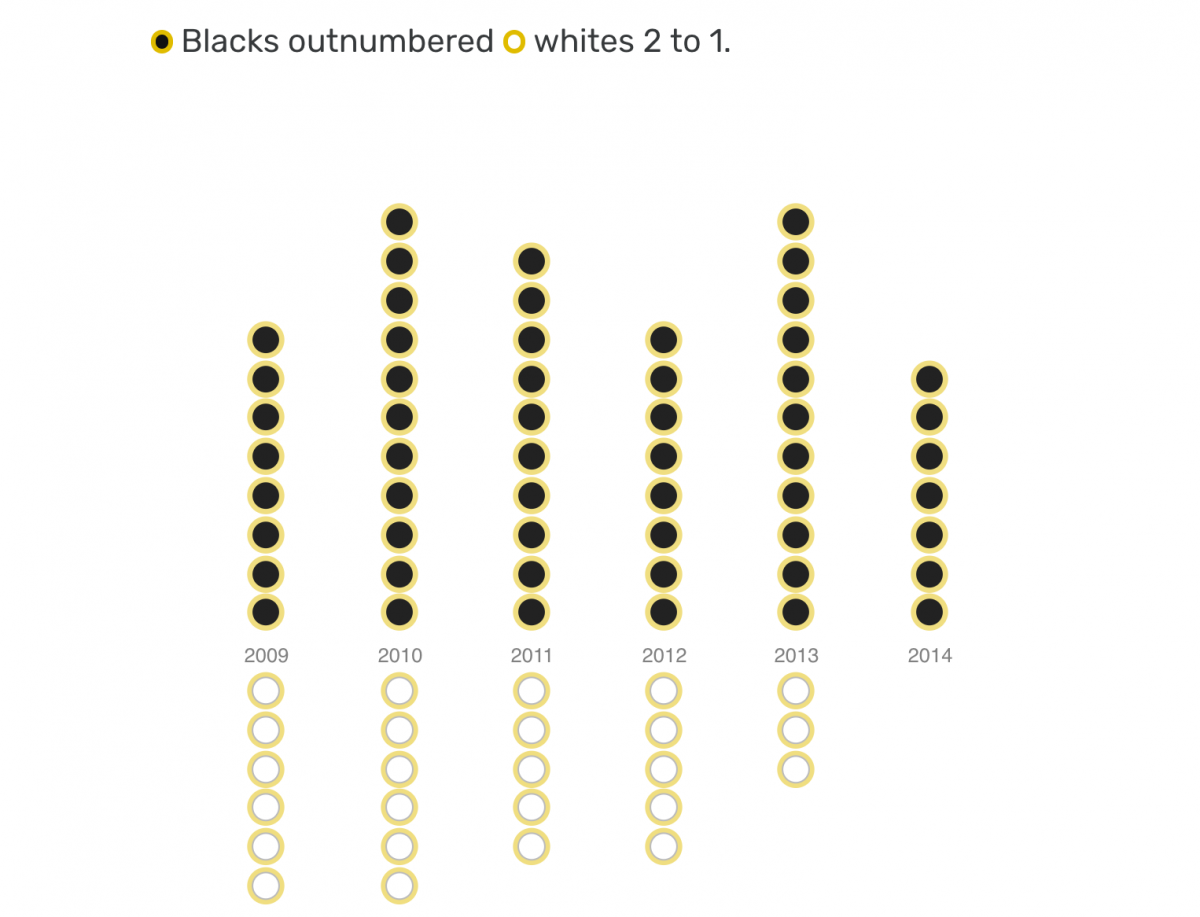
Bedi and his colleague Connie Humburg, a computer assisted reporting specialist at the Times, showed that there were evident racial patterns in the numbers – black people were shot more often than whites. The breakdown of unarmed people shot by police skewed even more black, Bedi and Humburg report.
Storybench spoke with Bedi about how his team tackled the project and why less is more when it comes to marrying code and story.
What were the different pieces that came together to create this project?
The graphic design, the visualization, the code… I did. Connie was the expert on the data that helped me analyze further and understand the patterns that we were seeing and then I worked on turning it into a story, drafting the words and the graphics simultaneously, with tons of help from our editors.
What was the concept behind this story?
When I came into the project, we had this great main story that used the data and reporting to try to explain this question of how these incidents end up happening. We felt like we could use the data even more and do something that was digital and interactive. We wanted to do two things: We wanted to have a platform to display all this data in a way that you could see the connections yourself. The second thing we wanted to do was the complete opposite: a really deep dive into a very specific part of the data. It ended up being these racial patterns. We didn’t know that when we went into it but we kept analyzing who’s getting shot in what types of circumstances and we just started to notice the very stark differences in how white people were shot versus black people.
What did you want users to get a sense of as they were clicking through?
We looked at hundreds of shootings and identified hundreds of people getting shot, and a lot of the patterns at play in well-known cases are also at play in cases you may have never heard of. That is part of the point we were making. You can’t make a reader sit down and read hours and hours of cases and make them feel what we felt when we read them. But we tried to boil down at least this part of the story by breaking up the numbers but also zooming in to some of the cases we had found.
Could you walk me through what your process was for this project, in terms of building the visualization and what tools you used?
“You can’t make a reader sit down and read hours and hours of cases and make them feel what we felt when we read them.”
We like doing drafts here. It morphed a lot from start to finish. I think originally I had coded the graphics to be almost 100 percent CSS with a little bit of Javascript and it ended up transforming into a whole lot of Javascript and D3 to visualize these dots and bring in these faces.
What were some of the challenges you faced in creating this data story?
It was tight at the end because we were still drafting. It’s not as easy to rip apart drafts when it comes to code. Sometimes you hit a bug that has nothing to do with the story or the visualization but you have to think it out, you have to spend time working through it.
Was it useful to have someone who was more on the data side on your team?
It was great. The last leg was just checking and checking the data to make sure we were correct, and Connie had such a mastery over all this data. I could come in and do a bit of analysis and I always knew she had my back to make sure my analysis made sense and was correct.
From data gathering to digital design, what advice do you have for journalists who are trying to build similar visualizations?
Generally, it’s a whole lot easier when you keep things simple. When I first started coding, I used to get really excited about really complicated code but it makes it harder to write drafts and change them over and over again the way you need to for a story in journalism. You can be far more compelling with far less on the page – and I think that’s almost a harder skill to learn, learning what you need and what you really don’t need. Sometimes less is more.