How Zhimin Huang is bringing a culture of data journalism to China
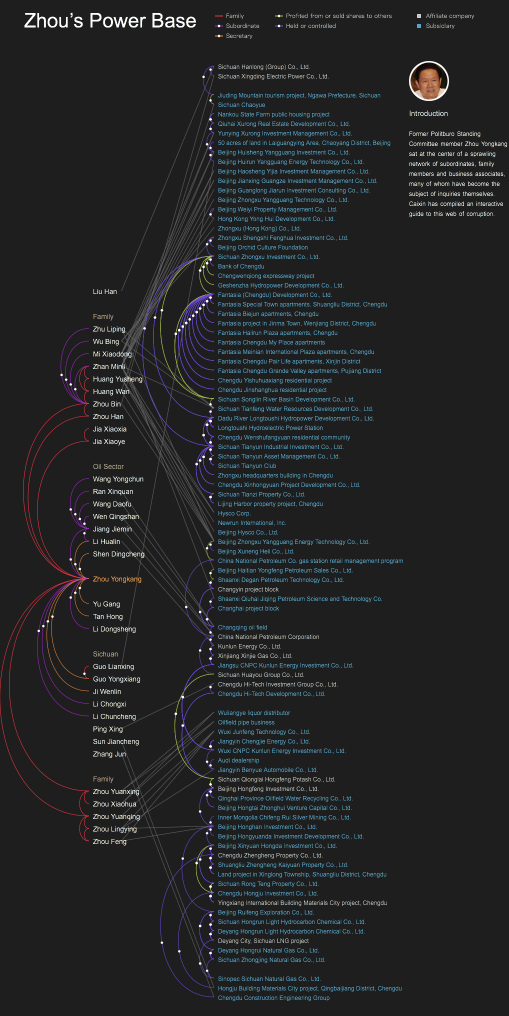
At the end of 2013, Chinese newsrooms got a tip that Zhou Yongkang, the former head of China’s security services, was being investigated for abuse of power and corruption, journalists began preparing investigative stories on Zhou. The interactive piece “Zhou’s Power Base,” produced by Caixin Data Visualization Lab, stood out among the thousands of stories on the topic. The visualization has enjoyed more than four million “clicks,” according to its producer, Zhimin Huang, the former Chief Technology Officer of Caixin Media and current CEO and founder of Dataworks.
Huang is widely cited as one of the first people to do data journalism in China and his visualization of Zhou’s web of power is considered a turning point in Chinese journalism. In 2014, the investigative project won an Award of Excellence from the Society for News Design. Storybench spoke with Huang about doing data journalism in China and about his perspective on data accessibility in China.
(This interview was conducted in Mandarin Chinese and translated into English.)

How did you begin working in media?
I graduated with a bachelor degree in material engineering but I have actually never had a job related to my major. I got a job for Netease in 1998 and did a lot of work related to the internet. In 2011, the editor-in-chief of Caixin Media, Shuli Hu, asked me to join Caixin and support her in bringing new media into Chinese journalism. During the 2,000 days working for Caixin, which now is the leading data journalism media group in China, I got to know a lot about media and finance. People have been saying I’m a tech-guy but the fact is I have been working in the media industry for so many years because technology and media are so interconnected.
 How did you come up with the idea of visualizing the story of Zhou Yongkang?
Caixin at the time wrote a 60,000-word story about Zhou. Surely it is excellent reporting; however, we found fewer people reading the latter chapters. There is a huge amount of information in the story that people might get tired of reading regardless of how excellent the reporting is. When I got the story from the editing group, I decided to visualize it so that people could understand the core of the story at-a-glance. That’s how data journalism works better than traditional journalism – it collects giant amounts of information and turns that into an interactive piece that makes it easier for people to understand what’s happening.
What tools did you and your team use in order to visualize Zhou’s story?
We just used Excel to do the data cleaning and HTML and JavaScript for coding and visualizing. We started to work on Zhou at the end of 2013 when we heard that he would be investigated by the party, and finished in roughly three months. We published it on July 29, 2014, when the party announced that Zhou was under investigation.
What kind of stories do you think can be best visualized? How do you decide?
Frankly, visualization doesn’t work for every story. Before we visualize, we need to make sure the story is suitable for visualization. I think investigative and in-depth reporting are the best genres to visualize because they contain a lot of information and people are generally very interested in reading them. Also, the reporters can spend a relatively long time visualizing the information in an interesting and interactive way. We can do data visualization for metro news, too, but in a much simpler way because reporters are always under deadline pressure.
There are some “ground rules” when data journalists see a bunch of information. We know either bar charts or line charts work best to visualize growth over years. Because we are very familiar with how visualizations work best, we meet and discuss as a group before we actually start working on [a visualization]. We learn from each other.
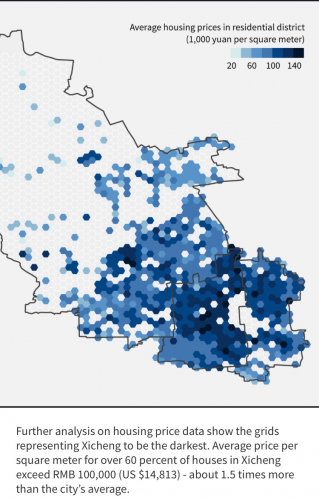
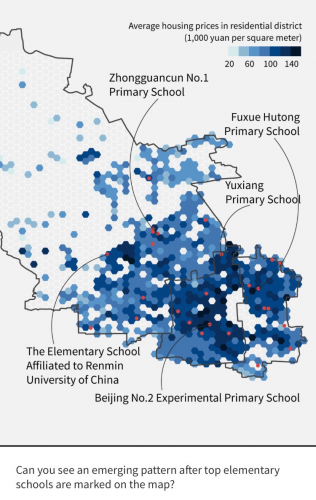
Screenshots from “Pay to Learn,” a project on school districts and housing in Beijing. Credit: Dataworks.
What kind of people do you think are essential for a well-oiled data journalism team?
Reporters who have excellent data storytelling skills and designers who can use colors and shapes perfectly. Engineers are crucial too because they are the people who can visualize the story with technology. I would say data journalism is such an interdisciplinary subject that requires each person to have a speciality. Getting to know some basic knowledge of other people’s work is also very important when we are working together. For example, journalism people need to know basic coding and design skills so reporters can understand what others can do about the visual.
What about open data in China? Is it difficult to get data in China?
China is now in the process of releasing more data. It is not difficult to find most court decisions and financial reports in China because the government and the party have been encouraging more data access to the public now-a-days. It’s surely good news for data specialists.
In which ways can data journalists find open data legally and ethically?
“I think very soon major newsrooms in China will have their own data journalism teams”
For me, looking for data in government and official media outlets is my top choice. No matter where we are, data published by the government can be considered relatively trustworthy. Third parties such as marketing or research companies is often the last choice – we need to be critical about their data and always double-check with other sources before we actually use them.
Do you have any suggestions for young people who are learning data and considering working in media?
The technology used in data journalism is not complicated at all – everyone can learn basic coding, either in Python or R, you name it. On the one hand, it is always nice to equip yourself with some technical skills. On the other hand, learning something new can make you think and make judgements in a different way, and also make you stand out. It doesn’t just apply for working as a data journalist in China but anyone who wants to work in a data-related industry in the future.
The data journalism industry is always eager for young people with interdisciplinary skills. The more you learn about these subjects, the more competitive you will become when you are out there hunting for jobs. Even if you are not a big expert in coding, if you are a quick learner, you can become very desirable in the media industry.
How do you think data journalism will evolve in China over the next few years?
It seems traditional journalism has been stagnant for a while and that journalistic values should evolve into new forms, such as data journalism. Data is definitely a trend helping revitalize journalism. I think very soon major newsrooms in China will have their own data journalism teams in addition to editorial teams. However, data journalism won’t replace traditional reporting; it is just another way to present stories and data in the format of technology other than video and audio.
Yumeng Ren also contributed to this interview.
- How Zhimin Huang is bringing a culture of data journalism to China - October 10, 2017


