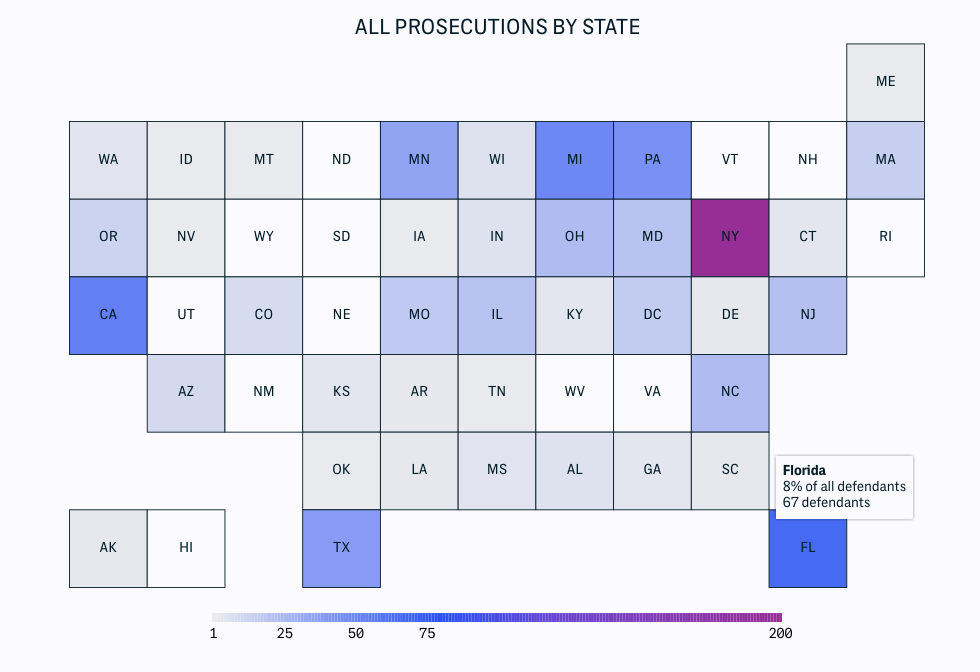
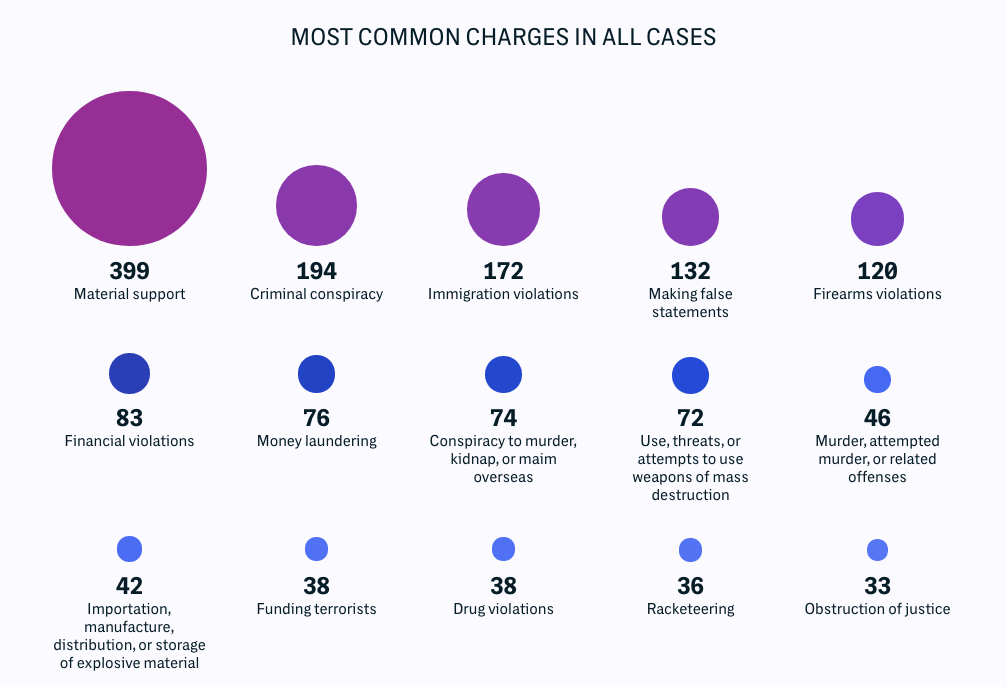
Last month, The Intercept published “Trial and Terror,” a database of – and series of stories about – the 796 people prosecuted for international terrorism by the United States since the attacks of September 11, 2001. To accompany the database, Moiz Syed, a data journalist and designer at The Intercept, developed a visualization to convey details of the cases, including the most common charges, terrorist affiliation and prosecution location, as well as individual profiles of the defendants.
Storybench spoke with Syed about the tools he used to analyze the data, his news organization’s approach to mobile design, and the importance of sharing this kind of data resource.
How was this story pitched and why did you get involved?
The project was initially pitched by Margot Williams and Trevor Aaronson who had been keeping track of how many terrorism defendants have been released from prison since 9/11. The project’s scope was expanded once we realized how comprehensive Margot and Trevor’s dataset was. I got involved in the project to help visualize the data and to figure out how to present it in different formats to our audience. I also got a enormous amount development help from Akil Harris and Westley Hennigh-Palermo, the two engineers from The Intercept’s research team to make both the reader-facing site and the newsroom tools a reality.
How did The Intercept’s mission guide this project’s development?
The Intercept has published many large document-based projects (Snowden NSA documents, SID Today, FBI’s secret rules, and Drone Papers) but this is the first time we have published a database accompanying a set of visualizations and stories. This project fits nicely with The Intercept‘s mission to bring transparency and accountability to powerful governmental institutions. We have a few more exciting projects in the works, but I can’t really talk about them.
How did you approach the design to convey the strongest story? What did you want to get across?
From a fairly early stages of this project, we were thinking about how we can build a resource with this dataset that we will keep updated as more terrorism prosecutions happen in the future. There are three ways we give access to this live dataset:
1. Our data analysis that we present with several visualizations for a casual reader who wants a summary of our findings
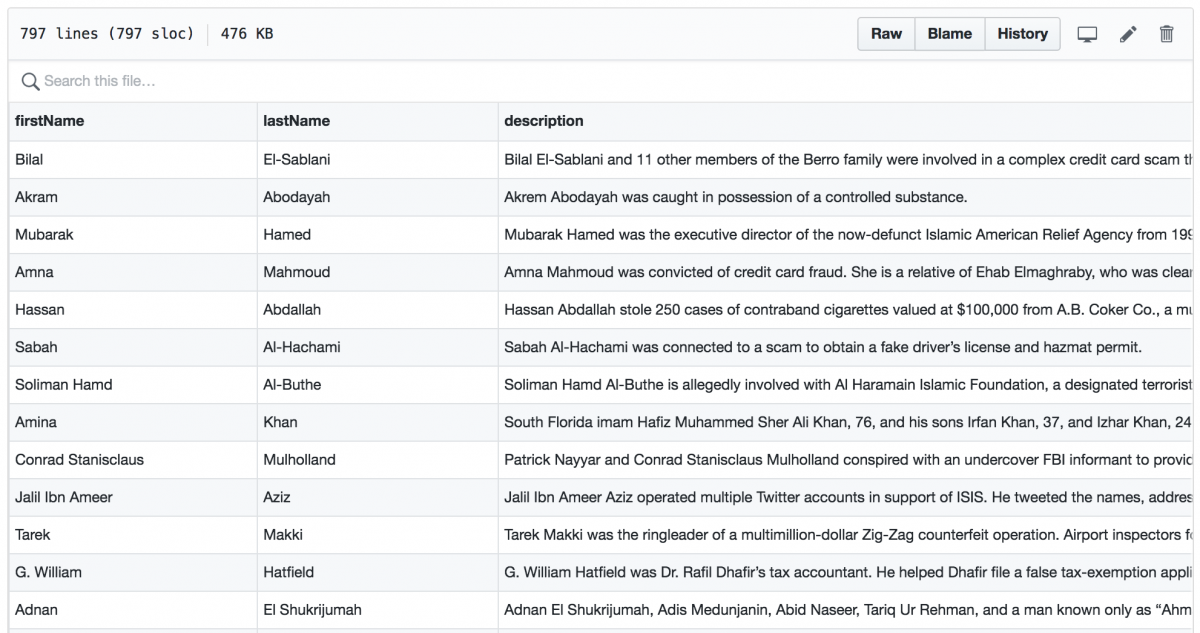
2. A filterable list of people within this dataset for people who want to dive a bit deeper into the dataset
3. A Github repository with an updated CSV file of this dataset for lawyers, researchers and others who want to build future work on top of this dataset
What kind of tools did you use for this project?
I did a lot of early data analysis with R, trying to find outliers and trends. I also used OpenRefine to do data cleaning. We built the project site with React, which lends us to build components that we plan to use for future projects. We also styled the site using Tachyons CSS framework, which probably saved me many hours of my life.
What was your thought and design process behind the mobile development?
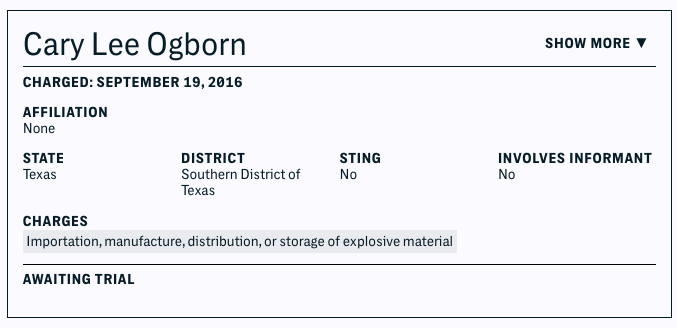
The Intercept published individual “cards” for each defendant.
Every bit of our site works on mobile and we don’t treat it as an after-thought. This is still hard sometimes because we work primarily on a big screen display and its easy to forget that a huge chunk of your readers will be accessing the site on a much smaller screen. A lot of time we had to simplify our designs to make sure they worked and looked right on mobile. Using Tachyons, which is a responsive CSS framework, helped a lot in building a website that worked on all screen sizes.
The database The Intercept has curated is available for download. Why was that important to the team and what do you hope people do with it?
We want our process to be transparent and our work to be reproducible like good science. Publishing good notes on what the sources are for the dataset and making the dataset available is crucial for this.
Aleszu Bajak was the founding editor of Storybench. He is currently the director of data visualization at the Urban Institute. Previously, he was a senior data reporter on USA TODAY's data team, part of the newspaper's national investigative unit. He is a former Knight Science Journalism Fellow at M.I.T., was a founding senior writer at Undark magazine and founding editor of Esquire Classic, a project resuscitating the magazine's archives. His work has appeared in The New York Times, The Washington Post, M.I.T. Technology Review and Nature.