
How Hollywood Miscasts Asian Americans: Dorothy Lu on Using Data Visualization to Set the Record Straight
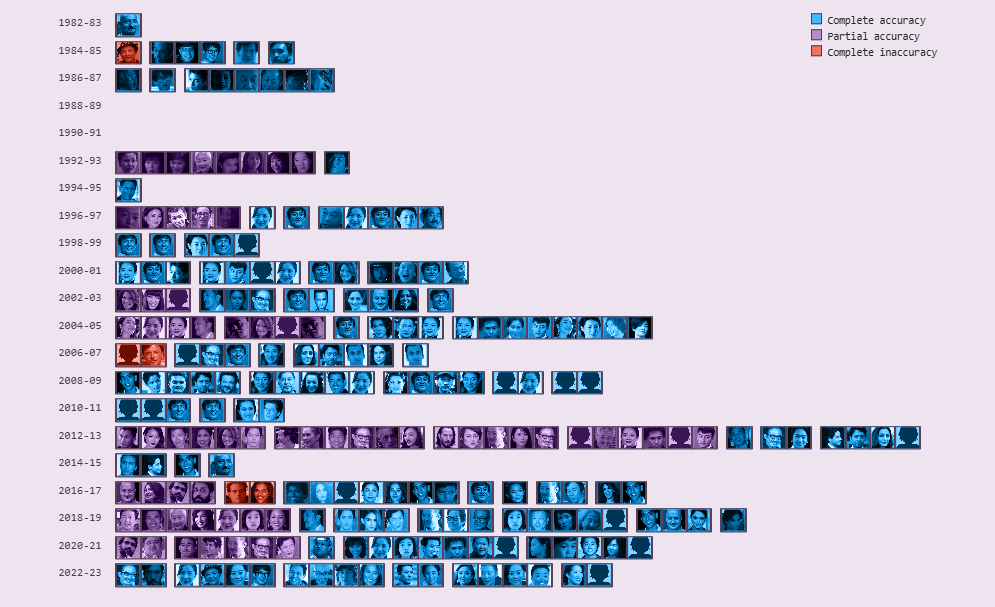
Freelance data journalist Dorothy Lu, along with her roommate, illustrator and developer Anna Li, created “How Accurately Are Asian Americans Cast in Hollywood?” for The Pudding after the pair noticed an increase in Asian-American movie roles. As two young Asian-American women, this kind of representation was amazing to see but they thought something was a little off. Lu began to notice significant miscasting when it came to Asian-American actors whose ethnicities and heritage didn’t align with the roles they were portraying. The pair decided to create the project using interactive data visualization to discover out how often Asian actors are miscast on the basis of ethnicity. But there was just one problem — there was no available data on Asian representation/mis-representation in Hollywood. So, Lu decided to create that data set herself.
The following interview has been edited for clarity and length.
At what point did you realize you were going to have to build your own dataset rather than relying on existing sources?
Baseline representation data has improved a lot, but understanding what that representation looks like requires more nuance. Before we got to the actual data analysis we knew we needed to do a quick rundown and see how diverse the Asian American experience is these days. Essentially to make a case of why it’s relevant and then layering in with the concept of matching ethnicity in the media. That specific layer of ethnicity correlation between actor and character just wasn’t compiled anywhere.
How did you decide to display the data visually, specifically in the scrollytelling format?
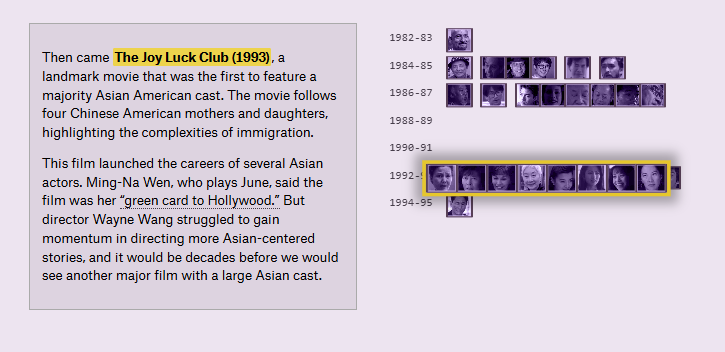
Because this project was so open-ended, we had many different drafts for visualizations and how it could look. We wanted to display it in a way where even if you don’t click through it, you can still get the larger concept, while also giving readers who want more depth the ability to click in and get more information.
We wanted some sort of scrolling or interactive piece and I think it works well for this data too. Just off of the first pass one will see how representation has increased but as you look into it more there’s much more nuance. For example, you can look at the big five production studios or films with only Asian directors.
How did you decide what data to include in this piece?
I think there are two layers to it. The first one is on a movie level, and then within each movie there’s the actors and the characters. In terms of what movies we chose to include, I think this was definitely one of the harder parts of the data collection and I think it was a bit more subjective too because there’s just so many ways to make a case for why a movie should or shouldn’t be included. We ended up using a movie database that agents in Hollywood use called Luminate and they have profiled all actors and the movies these actors were in. This database also used a score of 0 to 100 to measure their popularity and anything above a 60 would mean the actor was pretty relevant. We also used IMDb to look at popular movies.
Can you walk me through what the data collection process actually looked like?
I’m sure there were better ways to scrape the data but we quite literally went into every Asian-American actor in Luminate, pulled a list of all their movies, and then we researched each movie. The first pass was to see if the movie had relevant and meaningful Asian experience. I think this aspect was hard because it’s a really hard call to make as to what defines an “Asian experience.”
Then we did research on our own. We had to research each movie to see what ethnicity the character is supposed to be, so we used movie transcripts, articles about the movie, etc. Then, for the actor portion, we looked at actors’ interviews to understand about their own ethnicity and because we were using mainly more popular actors their information was more readily available, we were just Googling and looking at anything they’ve said online.
What was the hardest part of creating this article?
Deciding what counted as a relevant Asian experience in a film was difficult because it’s really subjective. Also, I think not everyone feels the way we do about Asian-American representation. Some people will say “well any representation is good representation” and wonder why we’re being so nitpicky about things not being represented correctly. But this is really important to us and I was just telling myself, “I’m not trying to represent all Asian-Americans in this opinion.”
Another challenge: this was my first time doing a project of this magnitude and I think writing data journalism can be complex because it covers a lot more technical concepts. It can also be tricky to avoid overexplaining when the data can speak for itself. Readers have to fit the pieces together of why something is important and so my first drafts were too long and that was a challenge of how does the writing and the data visualizations work together to communicate?
Why do you believe it matters to build original data for stories like this where the data simply isn’t there?
When we finished compiling our data set and spoke with Alvin Chang, a data journalist at The Pudding, he was like “You guys are now the only people in the world with access to this specific data set.” It’s worth understanding what that representation actually looks like and how we can continue to improve. Compiling something that isn’t readily available is really a way for us to grasp the current situation but also have a good idea of what we want the future of Asian representation in the media to look like.
Why do you think data visualization is so important to journalism today?
Data just provides a different perspective on certain issues, for example, gerrymandering and voter suppression, people often only think about that in the context of social issues. But if you understand the data behind this, you’ll see that there are many ways to manipulate gerrymandering so that no matter how many people vote, the result will always be the same. That’s a different kind of understanding, and in itself is power as it provides a newer lens.