Assembling a searchable interface of Boston police misconduct data
The public’s desire for transparency about police misconduct in Boston has never been greater, yet the city’s police department makes finding that information difficult.
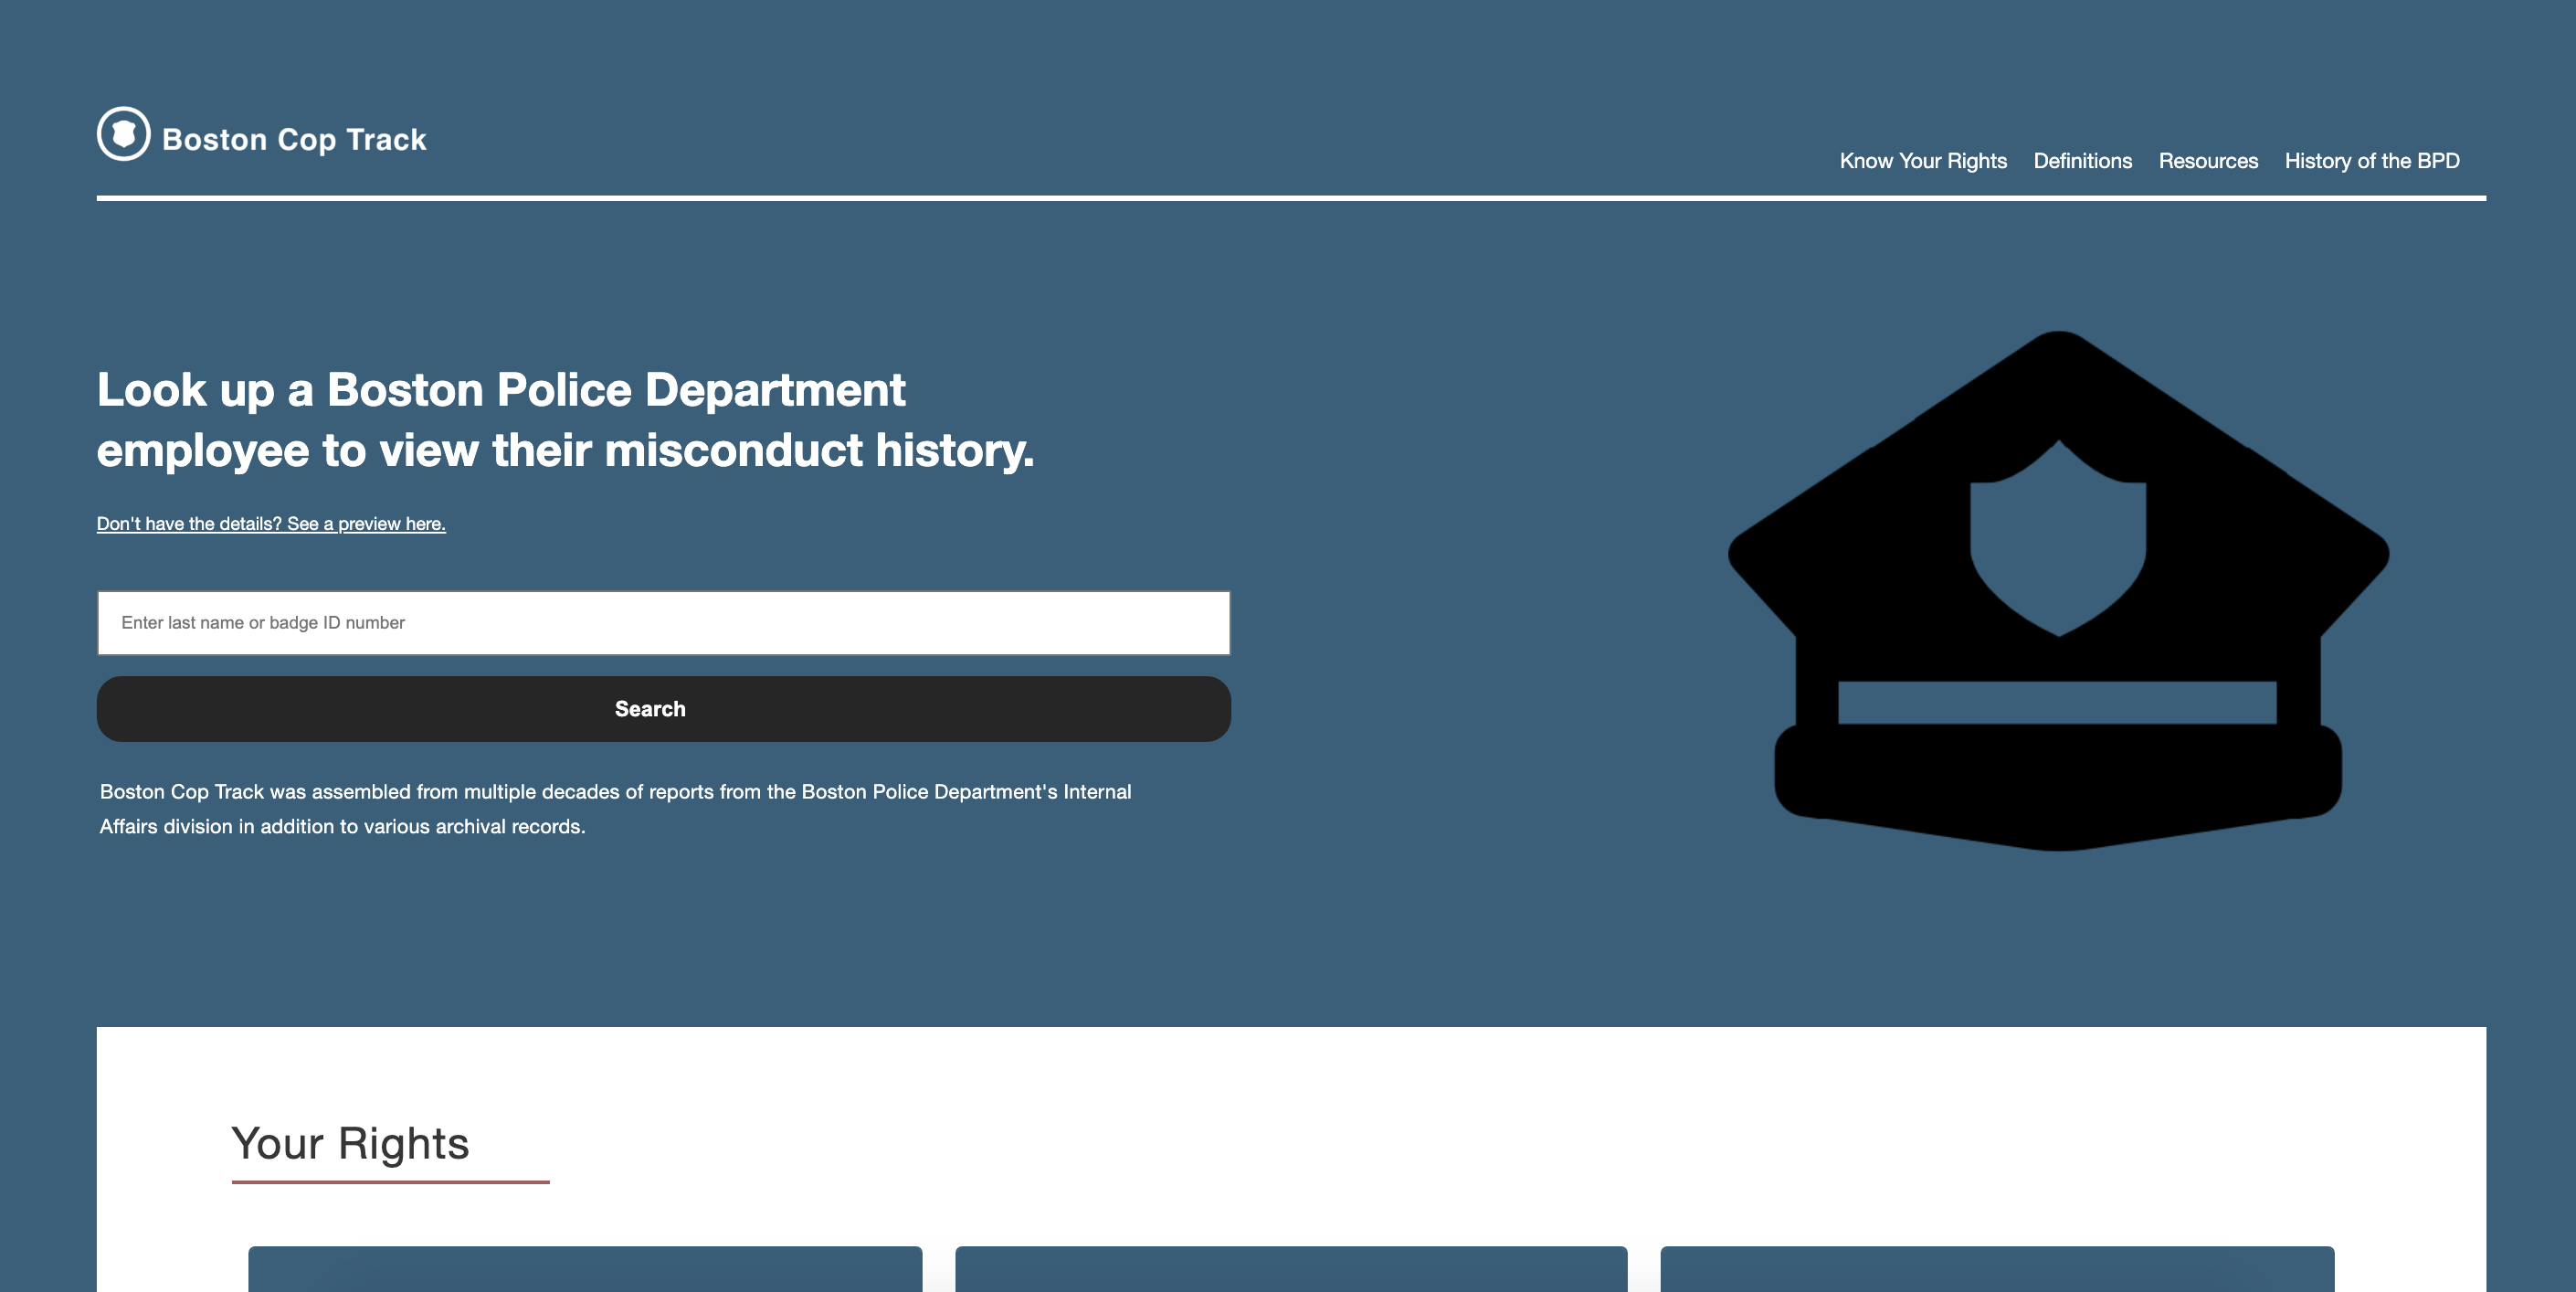
That’s why I built Boston Cop Track, an online prototype documenting police misconduct claims within the city of Boston, designed to serve as a tool for civilian use. A user can look up a Boston Police Department employee through their name or badge ID number and see their entire cataloged history of misconduct allegations — sourced from over two decades of Internal Affairs Division records.
While interacting with an officer, a person might want to know more about their history — so that information needs to be succinct and accessible.
Assembling the data
The first challenge in building Boston Cop Track was that no single source held all of the information needed. I compiled the necessary data within two Excel spreadsheets. The first contained misconduct allegations leveled against BPD employees through their Internal Affairs Division from Jan. 1, 2001 to Aug. 15, 2020. It features more than 10,500 rows of allegations concerning over 2,100 BPD employees.
The most important variables in the allegations data set are descriptors of the alleged events that took place. The first being the incident type, meaning the actual internal term used to describe the allegation being leveled against that officer.
This can vary, but the most common incident types I’ve come across are “Use of Force,” “Respectful Treatment” and “Neglect of Duty/Unreasonable Judgment.” These are vague for a reason, and serve more often than not as umbrella terms to encompass a wide variety of misconduct allegations.
Also of note is the finding of that allegation — usually either “Sustained,” “Not Sustained” or “Unfounded,” and the penalty (if applicable). While assembling the data, I found that a majority of those penalties simply came down to an “Oral Reprimand,” or nothing at all. Even when these officers are held liable for their actions, the systems in place will often refuse to punish them.
The second spreadsheet holds identifying information about each BPD officer. Each complaint in the spreadsheet of allegations can be linked to data about the officer involved in the complaint, using a combination of name, badge ID and employee ID to join the data in these separate spreadsheets together.
Translating the data
Translation became the next issue. The language used to describe allegation types or outcomes can appear vague and hard to decipher if not a member of law enforcement. This led me to create a data dictionary, which involved scanning through PDF handbooks online for definitions to terms and consulting the archives of the Boston Public Library for internal documents that hadn’t already been digitized. The data dictionary aided in translating the vague BPD terminology into phrases easier to understand and make sense of.
Building the prototype
To achieve the goal of displaying key pieces of information in a dynamically generated way, I employed the JavaScript library D3.js. That library was loaded within the <head> element of the prototype’s HTML pages.
<script src=”https://d3js.org/d3.v7.min.js”></script>
Search function
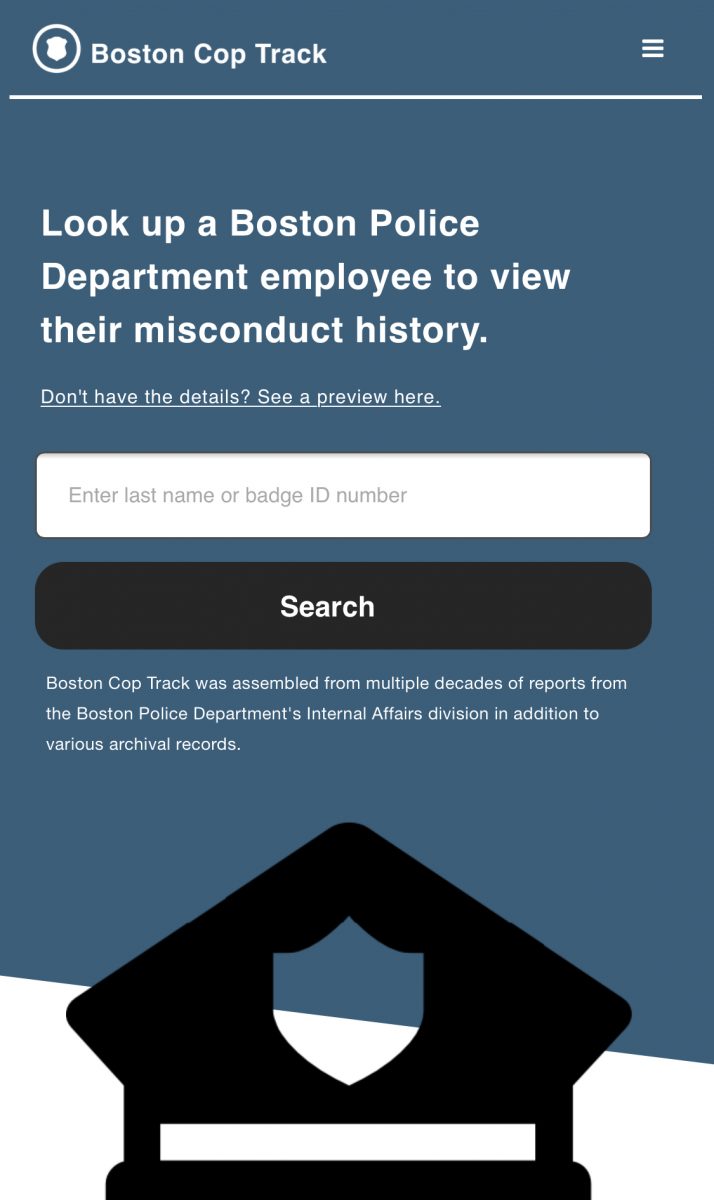
The landing page of the prototype contains a search function. The user can type either a badge number or an officer’s name into a search field and a page displaying data about that officer is loaded as a result.
To achieve this search function, I started by loading the data in the officers spreadsheet into the browser.
d3.csv(“./data/2021-11-04_officers.csv).then(function(data) {
    let ids = data.map(function(d) {
        return d.badge;
});
Next, upon clicking the search button, the Javascript retrieves what the user has typed into the search box.
d3.select(“#search--button”).on(“click”, function( ) {
    let search_value = d3.select(“#search--value”).property(“value”);
    // Continued…
});
Then it’s determined if that search value is a badge ID or an officer’s name. The end objective here is to generate a URL that uses an officer’s badge ID as a hash and redirect the user to that URL. In order to construct that URL, there are two possible paths — either determine if the user’s input is a badge ID or determine that the user’s input is a name, and use that to indirectly find the badge ID for the matching officer.
If it’s a name, it will filter the officers array to find the officer whose last name matches what the user typed in. From there, it will extract the badge ID of the officer — generating a URL that uses the badge ID in a hash and then redirects the user to that generated officer page.
 if (isNan(search_value)) {
            let officer = data.filter(function (d) {
                return d.last_name.toLowerCase( ) === search_value.toLowerCase( );
        })[0];
            let badge_id = officer.badge;
            let url = ‘./single-officer.html#${badge_id}’;
            window.location = url;
If the search value is a badge ID, it will generate a URL using the badge ID in a hash, and redirect the user to that page.
 } else {
            let url = `./single-officer.html#${search_value}`;
            window.location = url;
        }
});
The Officer page
Each unique officer page was dynamically generated, using an HTML template that gets populated with data tied to the searched-for officer. The JavaScript queries the spreadsheet of allegations, retrieving all complaints filed against that officer based on their badge ID. Those complaints are then used to populate the HTML template (by generating a <div> container for each complaint) and display the data to the user.
Displaying the Officer data
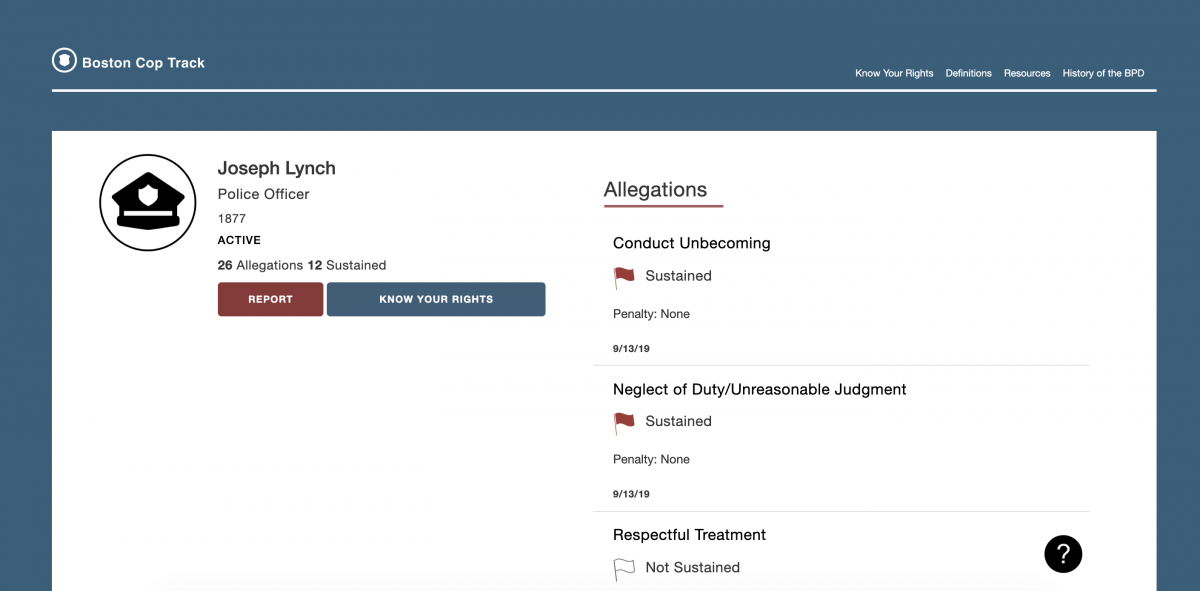
There were a few basic pieces of identifying information for each officer displayed in a profile section of each generated page. In the end, I decided to include the officer’s name, rank, badge ID, active status and the number of allegations leveled against them, as well as the number of sustained allegations.
The first thing I had to do was filter the allegations data into an array which only contained the allegations for the officer displayed on the page. I chose to name this array “filtered.” Working with this array ensures the allegations displayed to the user pertain to the specific officer whose badge ID generated the URL hash.
let filtered = complaints.filter(function(d) {
    return d.badge === badge_id;
});
Those allegations with the finding of “Sustained” are the true tells of their behavior, as that investigation revealed the alleged incident did occur and the officer was found liable for what happened. Filtering the data to find the allegations where the finding was “Sustained” and then using .length on the “sustained” array, returns the number of sustained allegations for the officer.
let sustained = filtered.filter(function(d) {
    return d.finding === “Sustained”;
});

let sustained_count = sustained.length;

d3.select(“#counts”)
    .html( `<b>${count}</b> Allegations <b>${sustained_count}</b> Sustained`);
});
Displaying the Allegations data
The next task was to decide what information about each allegation was important enough to display on each individual officer’s page — simplicity was integral to making the data easy to understand. In the end, I chose four variables to display for each allegation: the incident type, the finding of the allegation, the penalty (if applicable) and the date the report itself was received.
filtered.forEach(function(complaint) {
    let div = d3.select(“#complaints-container”)
        .append(“div”)
        .attr (“class”, “allegation”);
    let definingDiv = div.append(“div”)
        .attr(“class”, “allegation--data”);
    definingDiv.append(“span”).html(complaint.allegation);
	// Continued…
});
I wanted to acknowledge when a finding of “Sustained” did not result in a documented penalty for that instance of misconduct, so I created a condition which would display “Penalty: None” if that variable in the spreadsheet was blank. The ‘complaint’ parameter is a reference to each individual allegation against that officer inside the above .forEach( ) method.
if (complaint.finding === “Sustained”) {
	if (complaint.penalty === “”) {
		div.append(“p”).html( `Penalty: None` );
	} else {
		div.append(“p”).html( `Penalty: ${complaint.penalty}`);
	}
};
Additional features
The prototype features a “Report” button on each officer’s page, leading directly to the BPD’s online complaint form, which a user can fill out and submit to the Internal Affairs Division.

Also included in the prototype is an interactive “Know Your Rights” section, which tells a user what their rights are in potential situations they may encounter with the police in Massachusetts (i.e., someone is pulled over by the police, stopped in public, etc.).

The BPD has refused to release any misconduct data past August 2020, which serves to emphasize why a prototype like this is important.
Police departments make their data on misconduct difficult to access and the reasons behind complaints vague and hard to understand. Finding ways to present data in simple, accessible formats can help point out cracks in the city’s foundation and give people interacting with the police the necessary information to stay safe and informed.

- Assembling a searchable interface of Boston police misconduct data - January 28, 2022


