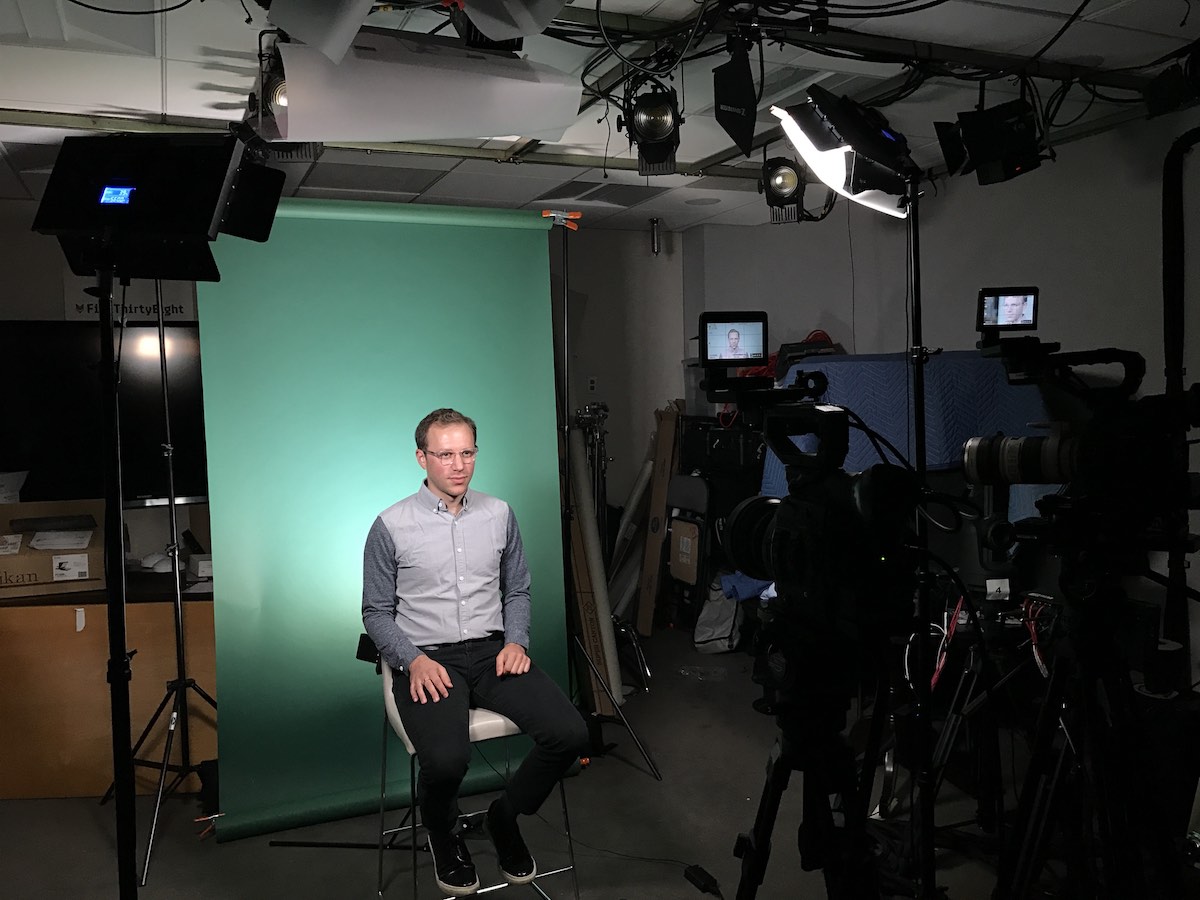
Behind the scenes with Galen Druke and FiveThirtyEight’s Politics podcast
The countdown begins. One week until the midterm elections. The politically curious are torturing themselves by hitting refresh on polling data and clinging to forecast updates from sites like FiveThirtyEight. Even at this late stage, some competitive races have little to no polling, meaning that forecasts could be missing crucial indicators.
To help make sense of the high stakes of this election year, FiveThirtyEight’s politics has capitalized on the popularity of audio storytelling, offering a podcast discussion to supplement the site’s interactive data visualizations and House, Senate and gubernatorial forecasts. In the podcast, founder and editor-in-chief Nate Silver and his team takes listeners on a journey through the political landscape by diving into polling data, explaining their statistical model and unpacking individual races. Recent episodes include “No, The Model Doesn’t Care About The Early Vote,” “How Voting Laws Will Affect the Midterms” and “What On Earth Should We Make Of The Democrats’ Huge Fundraising Edge?”
Storybench sat down with Galen Druke, podcast producer and reporter at FiveThirtyEight, to find out how he and the team make the midterm elections and the politics beat great for audio.
Let’s start with your take on the “rules of podcasting.” In terms of researching, scripting, and recording technology, what goes into preparing each episode?
It might not be that interesting, but we use Google Docs, Slack, and web browsers. Our office runs on Slack because it’s convenient for so many people who work remotely or are traveling for work, so we basically have our editorial meetings (as far as the podcasts are concerned) in Slack.
The editing process is oftentimes done on Sunday night or Monday morning, when we write the script from home in the Google Doc, Jody [Avirgan] and Micah [Cohen] will edit it, and we can go back and forth. In terms of sources for our topics – obviously, we have a lot of reporters in-house who are crunching numbers and finding unique ways to look at the data to develop our own ideas. Other times, we’re responding to breaking news in emergency podcasts.

What kind of news sources are you following?
A lot of people on staff are heavily involved on Twitter. We use a lot of The Washington Post, The Wall Street Journal, and The New York Times. In addition, Politico, The Hill, and your pick of right and left magazines like The New Yorker and The Atlantic, or The National Review and The Weekly Standard.
How much of a politics podcast is guided by intentional talking points, and how much ends up like organic dialogue?
It changes from episode to episode. In advance, we basically have a full script: host intro, transitions between topics, questions written out that have already been edited. Oftentimes, before we record, we talk as a group about the kind of questions that we want to answer when we’re taping, so contributors know what to expect and can think about their answers in advance.
On a Friday or over the weekend, I’ll also send out a reading list – pieces that our podcasters should contribute, use to guide their analyses, data sets to use, or things they might agree with and disagree with.
What digital tools and tech are on your radar right now?
As a reporter in the field, I go out into the world and talk to people (see The Gerrymandering Project or the Texas 7th forecast). For audio recorders, our tried-and-true tech is a digital recorder, a microphone, and a bunch of batteries.
As far as someone who is starting out in journalism and interested in broadcast, one of the great things about radio is that there’s a pretty low barrier to entry. You can do all the production on your own out in the field – you don’t need a camera person or a lighting person. All you’re focusing on is the information and the ability of your subject to convey that information. So you know you can really focus on the story, and not worry about visual elements (like where the sun is hitting).
A good example of a website that aggregates all of the polling on a particular topic is Pollingreport.com, where if you want to find polling on foreign policy, healthcare, or something else, it itemizes past polling based on specific issues.
Other tech tools that we use? Google Docs.
How have you seen the podcasting space change over the last few years?
From nonexistent to where we are now! When I started in public radio, I was working alongside people who were used to editing stories by actually cutting tape and stitching it back together. After trying to find audio work in New York in 2012, my first full-time job was working at Wisconsin Public Radio. At the time, not even Serial had been released yet, and the audio scene was a lot more of a buyer’s market, in that public radio companies could take their pick of talent, and everyone was scrambling to a get a limited number of jobs.
After two and a half years, I moved back to New York to find the audio industry totally transformed. It’s no walk in the park, but it’s no longer about waiting for one particular job opening at the one public media company in your market. Its radically different. It’s a more enjoyable and creative place for producers and reporters as a result.
In the “model talk” episodes, you’re often conveying visual polling numbers and data through audio. What are the major advantages and challenges of bringing this content to audio?
I definitely think our data visual team does a much better job of conveying these things than we could ever do in audio, and I would wholeheartedly tell anyone who listens to our podcast to go interact with those data visuals.
“Try to avoid listing numbers and try to tell a story around the numbers you are talking about.”
That said, a lot of people use podcasts to consume media during times when they couldn’t be a captive audience to a screen. It’s another way to try and get people comfortable and data literate when they’re on their commute, or for me, cleaning my apartment. It’s an issue of access. A lot of things are really well represented by visuals, but not everyone has that time.
Key to representing this content for audio is to 1) try to avoid listing numbers (sometimes you have to cut numbers down to the fundamentals); and 2) try to tell a story around the numbers that you are talking about. We’re coming from a site that’s trying to be precise, and to get that precision we’re known for, data visualization is the best way.
In a recent “model talk,” a listener question asked about interactive models, like a slider that changes the generic ballot. Can you elaborate on what features you think would most help users?
While we have a super talented team for creating forecasts – that I’m not involved in – I would say that being able to adjust the expected popular vote margin would help people understand the structures of our democracy in an interesting way.
If you could take a slider and put in the national popular vote in the House at 50/50 and see the result, you’d almost certainly getting a Republican House majority – you have to go up about six points until Republicans and Democrats have even odds of winning majorities in the House. Part of that is gerrymandering, part of that is distribution of people, and electoral imbalances are a result of the way that we have structured our democracy.
We structured our democracy this way for a reason, but it follows that we do not have proportional representation, so you cannot expect that a popular vote one way or another will lead to what our representative will look like. People can debate whether it’s a good or bad thing, but it’s been that way for a long time. Understanding the role of the popular vote is key to understanding the elections.
In that same “model talk,” Nate responded to a listener question and I was hoping you could take it now that the gubernatorial forecast is live. If there is or is not a “blue wave,” when we inevitably look back at current polling, what signs would you retrospectively say we’re seeing now?
If there is a blue wave, then the best indicators we have that it’s coming are the Democratic fundraising numbers and performance in special elections. The way that you can end up missing the mark is if the “likely voter” models are off. Maybe people are overcompensating for getting it wrong in 2016 and are missing what the turnout numbers will actually look like. If there’s a “tsunami,” the likely voter metrics could be higher for Democrats than we’re expecting. If this tsunami happens, then the fundraising numbers are looking like the outlier.
On the other hand, we could maybe be hyping our expectations based on those numbers. Another factor is that district level polling is lacking, so there’s a significant level of uncertainty. There’s even more because in presidential forecasts, we’re focused on national and state-level for swing states. There, we have more information than compared to state-by-state elections.
One of the most helpful aspects of your podcast are these listener questions. How do you think that these have changed?
I think people have definitely become more politically aware. Audiences really started consuming more politics content in 2015. When we started the podcast January 2016, a lot of our mission was to explain the fundamentals of how elections work to people who are not necessarily campaign managers or strategists or journalists themselves.
We want to give listeners the information to understand what does and what does not matter in an election, as well as that the process of using a historical precedent means you’re not always going to get it right. I think we’re still doing this.
Do you think you respond to listeners any differently now? What level of knowledge do you assume for your average listener?
I think we do have a loyal audience that already understands some basics, compared to some more “general audience” podcasts, like an NPR-style politics podcast that might go out of its way more to explain a term every time it’s used, like “margin of error,” “polling error” or “sample size.” For us, the fundamental aspects of polling and the uncertainty that comes with it have become part of our lexicon on this podcast. Hopefully we’ve helped people learn about how probability, elections and uncertainty work over time.
“Hopefully we’ve helped people learn about how probability, elections and uncertainty work over time.”
The goal is we’re always getting new listeners, so we still don’t assume that our listeners are the strategists. We assume our listeners are people who are politically curious so that everyone can feel like part of the conversation. The questions that we get remind me of what is and what is not common knowledge. Take the a question from last week, “How do pollsters define a likely voter?” That’s a pretty basic question that’s important to know, and I honestly didn’t even have the full answer, since there are multiple ways. So, this reminds me that there are basic ideas that we need to keep explaining and continue to help people understand the basics.
Another thing worth pointing out is that I’m not a quant guy. I’m more of a traditional reporter. Even if you don’t code or keep your own spreadsheets, being data literate and understanding where the uncertainty lies and how probability works, and all of these things. You can be data literate without being a “quant guy/girl.”
What would you tell prospective listeners who are still scarred from 2016 and lack faith in the polls? In other words, how would you sell this podcast to a skeptical listener?
The general criticism is “Oh, you got 2016 wrong.” A basic response is that, “Hey, we gave Trump a 30 percent shot and things with a 30 percent chance of happening are going to happen all the time.” Part of the reason that people so expected Hillary Clinton to win was the media narrative that went beyond the polling. In the broader mainstream media culture, there was this idea that this election was not lose-able for Hillary, which was different from the data that we showed on our site.
At the same time, I understand that for people who don’t use this data on a daily basis or aren’t as comfortable with it, it’s important to think about the ways that we confront uncertainty in our own daily lives. For instance, why do you have homeowners’ or medical insurance? You don’t expect your house to burn down tomorrow, but you know that it’s possible. We don’t think of uncertainty in the political world and personal life all that differently. We don’t think of uncertainty in the political world and personal life all that differently.
Part of living is understanding that not always the most expected outcome happens. That’s something we try to help people understand on the podcast – that just because the most expected outcomes won’t always happen, it doesn’t mean you should reject the method altogether!
We would argue here at FiveThirtyEight that the best way to understand how people think is to poll them. It’s asking more Americans than you could ever do with traditional reporting, and having them tell you what they think about the issues. I like to combine traditional reporting with a data aspect. With polling, you can do what traditional journalism does, which is ask people how they feel. But you can hit way more people than you ever could with traditional reporting.
Final bonus question: What is your favorite podcast right now?
Hm. I’m going to have to say the new Serial. Because the American justice system is really interesting and getting these kinds of stories is helpful right now.
- How The Pudding visualized the structure of Ali Wong’s stand-up comedy - February 7, 2019
- “The Immigration Experience” humanizes the history of immigration law. Here’s how. - November 9, 2018
- Behind the scenes with Galen Druke and FiveThirtyEight’s Politics podcast - October 30, 2018


