Build it, hack it, share it: Lessons from MIT’s Civic Data Design Lab director Sarah Williams
Build it, hack it, share it. This was the message that Sarah Williams, director of MIT’s Civic Data Design Lab and a professor of technology and urban planning, hoped to bring to a crowd of data enthusiasts during the final installation of the Northeastern University Visualization Consortium’s Fall 2017 speaker series.
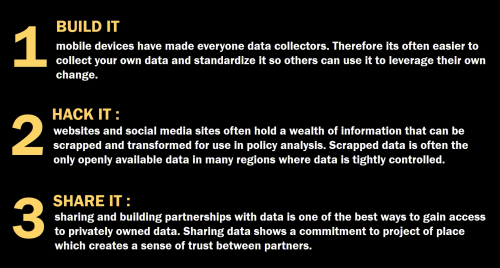
The three-part phrase is her lab’s motto, which they employ in an effort to harness big data and develop tools to spur policy change. Williams shared how she and her team built, hacked and shared data in projects touching on semi-formal public transportation in Nairobi, Kenya and ghost cities across China.
Build it
If there’s no existing data on a topic, Williams says the best thing to do is build your own. She did this in Nairobi, where she was tasked with creating a transportation model with little starter data. The primary source of transportation are matatus, or small, bus-like vehicles whose routes, stops and fares are determined by their drivers.
 With 3.5 million people depending on matatus and no source of information about their travel patterns, Williams asked herself, “How can we create broad data for our model, but data that everyone could use and build upon?”
To begin collecting data on the movements of the matatus, Williams partnered with the University of Nairobi to create an app that leveraged the high volume of cell phone use by Nairobians. Using cell phone data, Williams and her team tracked where the matatus stopped.
They then created a dataset of both formal stops – established by the government – and informal stops, which were much more frequent and often led to roadway congestion. “This was important because the reason they don’t use some of the formal stops is they are in sometimes actually dangerous and unusable areas,” Williams said. “It’s a combination of factors, and so really thinking about planning for this city we should think about where to actually optimize the stops to create less congestion but also safety for the riders.”
Based on the datasets, Williams began to split routes up, uniquely identify them and chart them on a map.
Hack it
While working on another project to assess the prevalence of Chinese “ghost cities,” or cities not fully occupied by residents, Williams had to scrape information from websites to find where these cities were located.
The ghost cities are a result of what Williams called a “ponzi scheme of development” where the government and the bank (which are one in the same) encourage developers to buy more plots of land to pay off previous plots they bought and built up but were unable to sell, meanwhile encouraging Chinese citizens to purchase two to four houses as an investment vehicle. No one moves in.
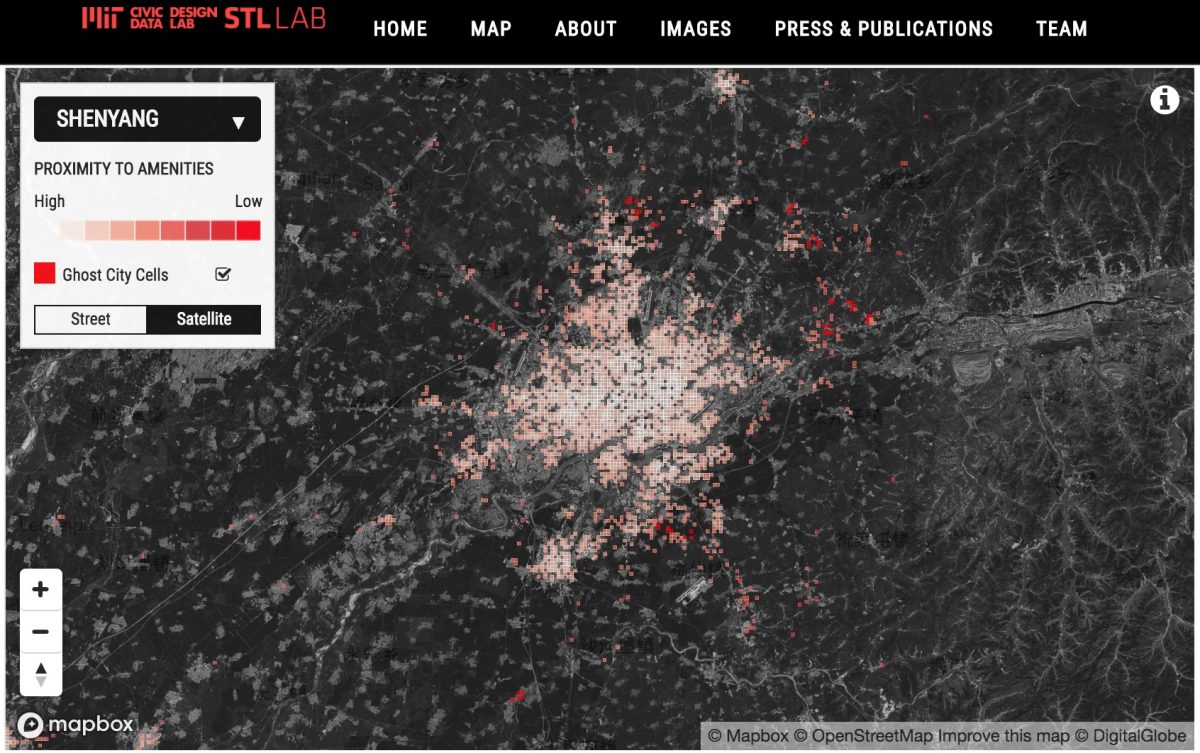
Williams mapped the ghost cities by scraping data from the Chinese equivalent of Yelp, having decided a ghost city would be characterized by a lack of amenities — grocers, hospitals, banks, shopping centers — for the given residential blocks. “If you don’t have a restaurant or a school or a grocery or a hospital to go to, you’re most likely not a viable community,” she said.
Williams used the Yelp-like website to locate these amenities and measure their distance from given residential buildings using an algorithm called Hansen’s Gravitational Model, which measures urban accessibility. By looking at how many reviews the amenities and properties had, Williams and her team determined whether the amenities were being used. From there, they calculated clusters of residential buildings and unused amenities that could be classified as ghost cities.
“I liken it to making foreclosure maps before they exist,” Williams said. “Mapping vacant residential developments can identify risk in the Chinese real estate market.”
Share it
How do you measure success in an open data project? “It’s when others leverage the data that you created to generate their own policy change,” said Williams.
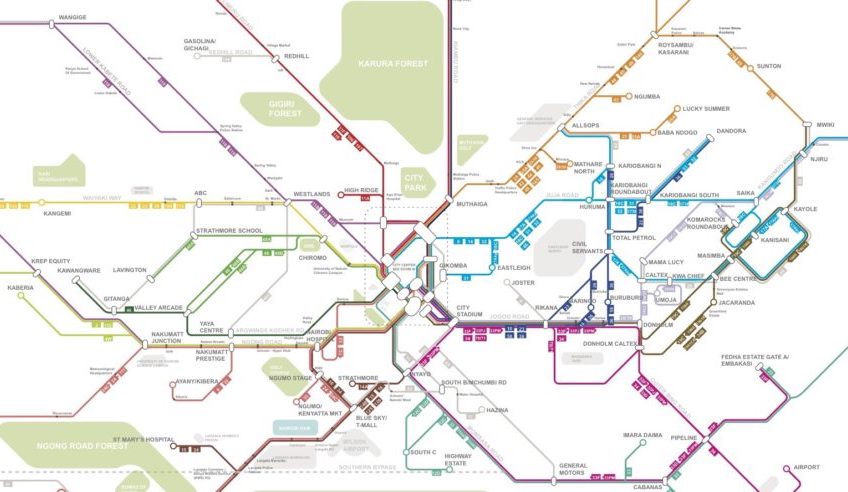
The matatu project resulted in a multicolored transit map and legend closely resembling that of any big city. The map highlights major stops and key points of interest to orient people. After releasing the map, Williams asked people, especially drivers, to help edit the data and the map to better suit their needs.
“I think what’s important about this, more than just the fact that the matatu drivers are helping us edit the map, is they are the main planners for these systems in the city,” Williams said, “and by having a visualization of it they can make more informed decisions about where to plan and put new services.”
“[Success is] when others leverage the data that you created to generate their own policy change.”
The team worked with the government, non-governmental organizations, matatu owners and drivers and released the map which went viral on the internet. This generated a discussion on how to address regulations and improve services for matatus and other semi-formal transportation systems.
Now, there are five transit apps that use Williams’ data to route users. The informal transit system also exists in Google maps, so people can get directions based on the matatus. A proposal for the bus rapid transit in Nairobi used the same kind of visualization as the one Williams released because the map had become so popular and iconic in the city. “Really, they were trying to use that representation to actually create the kind of change that they wanted to see.”
To share the model of Chinese ghost cities with relevant stakeholders, including urban planners, developers, local citizens and government officials, Williams’ team did a full analysis for 10 cities and created an interactive visualization to allow others to explore the model. People can click on cells representing cities to figure out what missing attributes makes them ghost cities.
Williams and her team are still trying to determine which stakeholders to prioritize in sharing their visualization.
“I guess one of the things that we were trying to understand is that, because the market works so differently from the U.S., who really stands to lose out in this ghost city development?” she said. “So we were trying to piece out that particular issue so we could figure out who our visualization would really help and benefit the most.”
The team ultimately hopes the maps can be used by local planners to think about how they can improve cities by adding the necessary amenities to make them viable communities. Bloomberg News in China is currently working with the data the team hacked and drone footage of the vacant areas to report on the issue, which Williams hopes will get the word out to more Chinese organizations.


