A dozen ways the midterm elections are being visualized
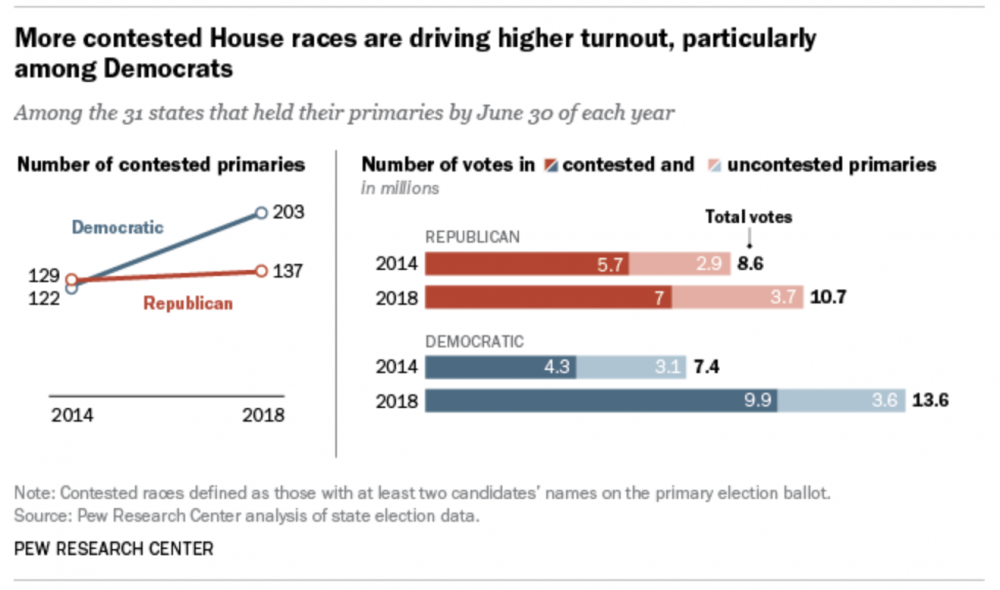
Midterm mayhem is fast approaching and with it, according to the Pew Research Center, voter enthusiasm. “Not only do about half of registered voters report being more enthusiastic than usual about voting, up from 40 percent in 2014, but turnout has surged in the 31 states that already have held their congressional primaries – particularly among Democrats.”
Given the high stakes of these elections – some predict a “blue wave” backlash to Trump’s 2016 election – it’s no wonder these midterms seem to be garnering more attention than in years past. But will that mean higher turnout rates than usual for the midterms?
And how are different media outlets visualizing the electoral landscape? Storybench rounded up several visualizations that help convey exactly what’s going on across the country.
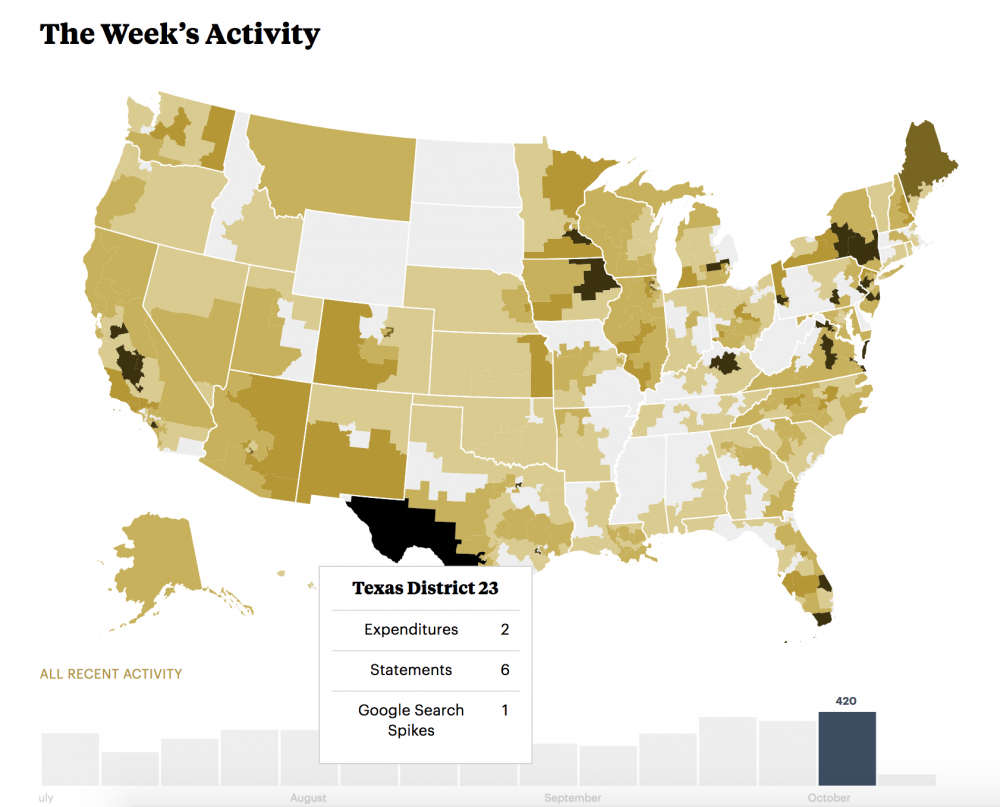
Election DataBot
Reporters, researchers and citizens can tap into county-by-county, race-by-race data using ProPublica’s Election DataBot, which continuously updates campaign information like campaign finance filings, changes in race ratings and deleted tweets on a weekly basis.
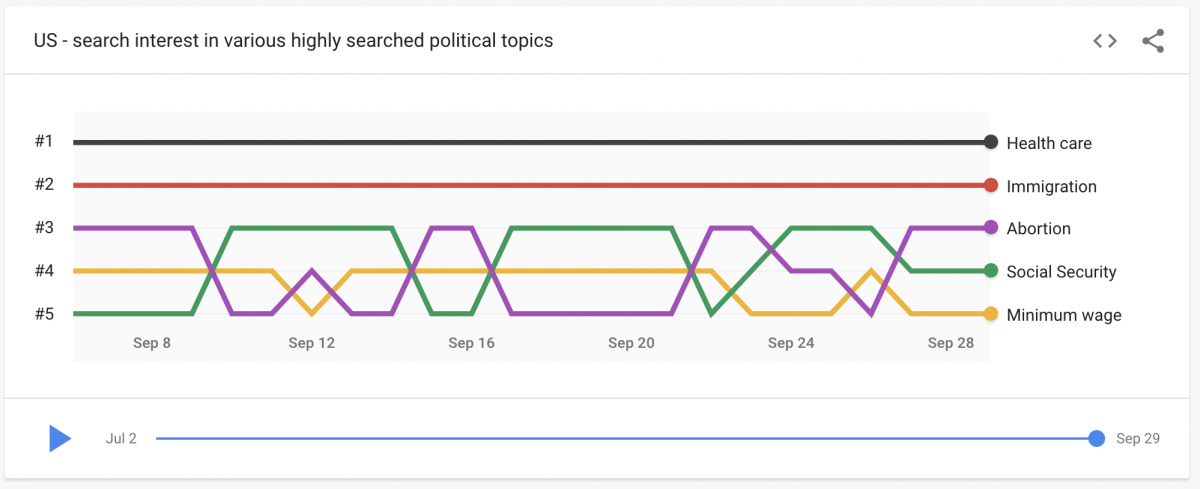
Google Trends Midterms
Use Google Trends Midterm Elections dashboards to gauge what and how people are researching as the 2018 elections approach. Check out the issues, region by region, too.
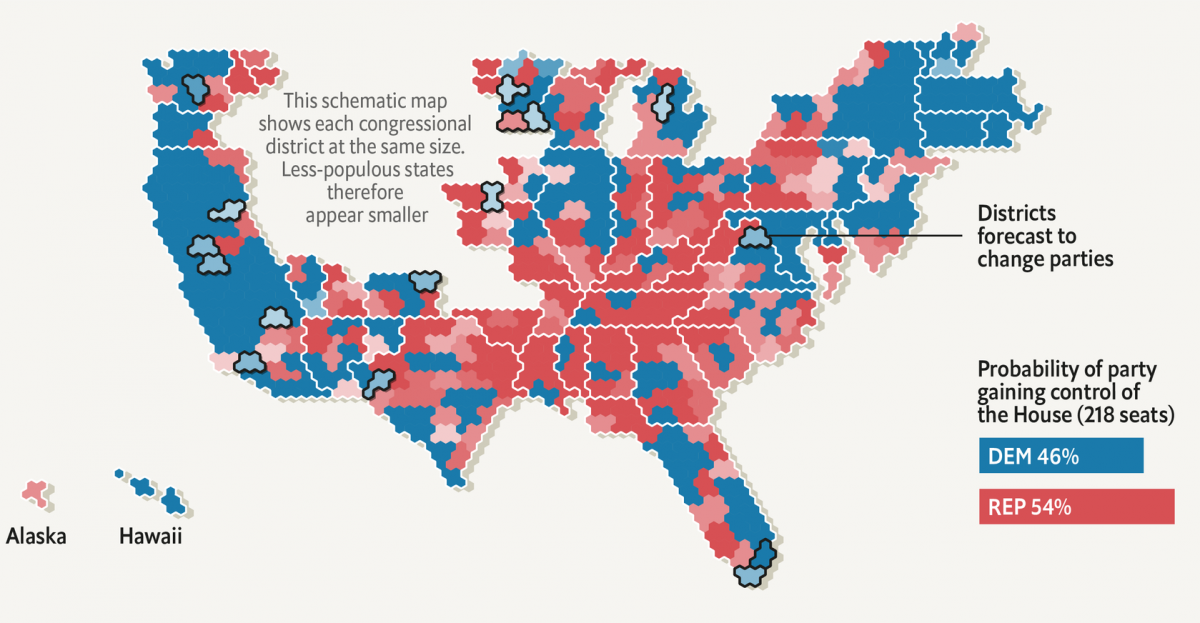
America in November
The Economist’s map shows each congressional district at the same size to give viewers an idea of what the country will look like Nov. 6.
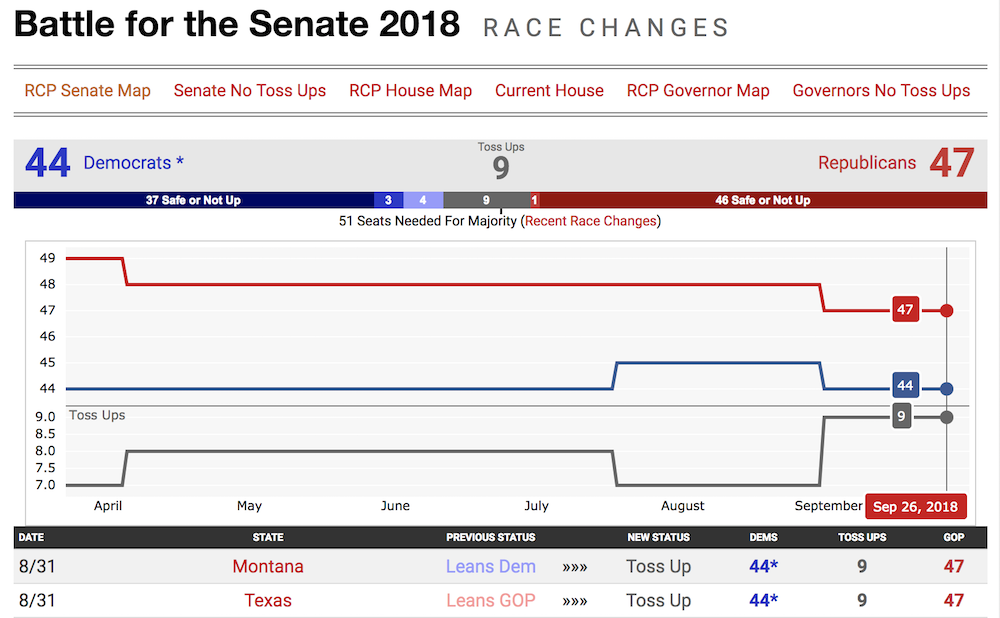
A timeline of changes
RealClearPolitics presents a timeline for tracking changes in the predicted outcomes for each state’s races. Currently, their polling reports that nine states are considered “toss ups.”
Ballotopedia’s battlegrounds
Likewise, Ballotopedia has dubbed 16 Senate races as “battleground” elections, including Texas, California, West Virginia and New Jersey.

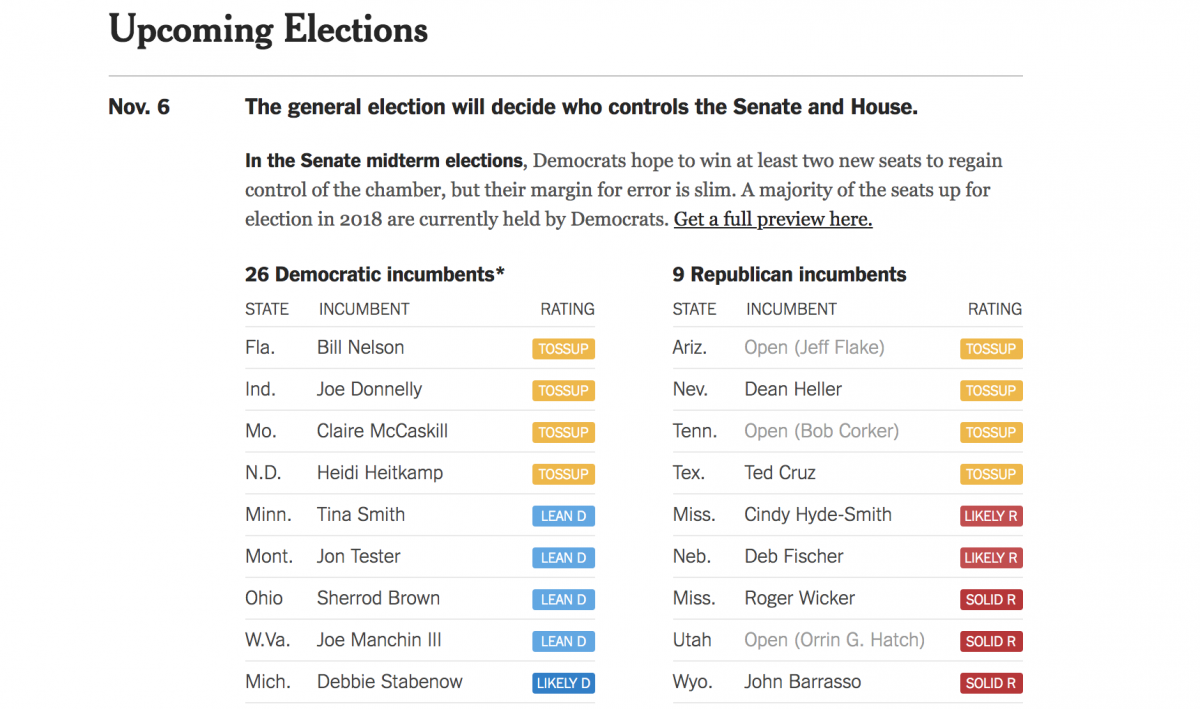
Keeping up with an election calendar
The New York Times has designed a succinct resource for readers to quickly get an idea of the electoral landscape. They, too, refer to battleground races as a “tossup.”
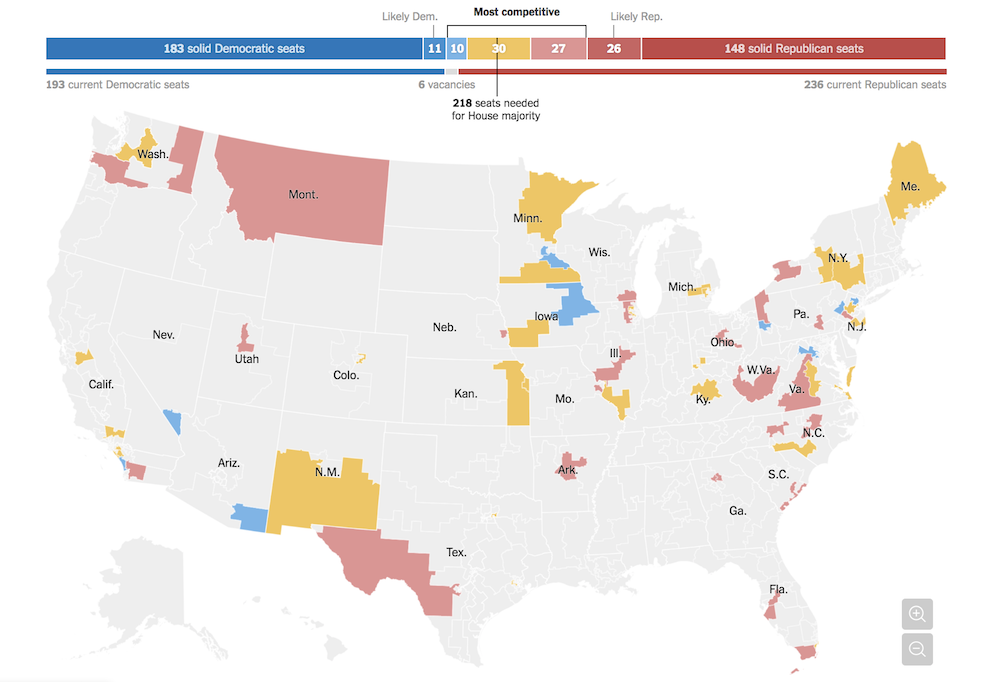
Pinpointing the House races to watch
The New York Times has also drawn up an interactive map pointing out hotly-contested seats in House races, based on the Cook Political Report.
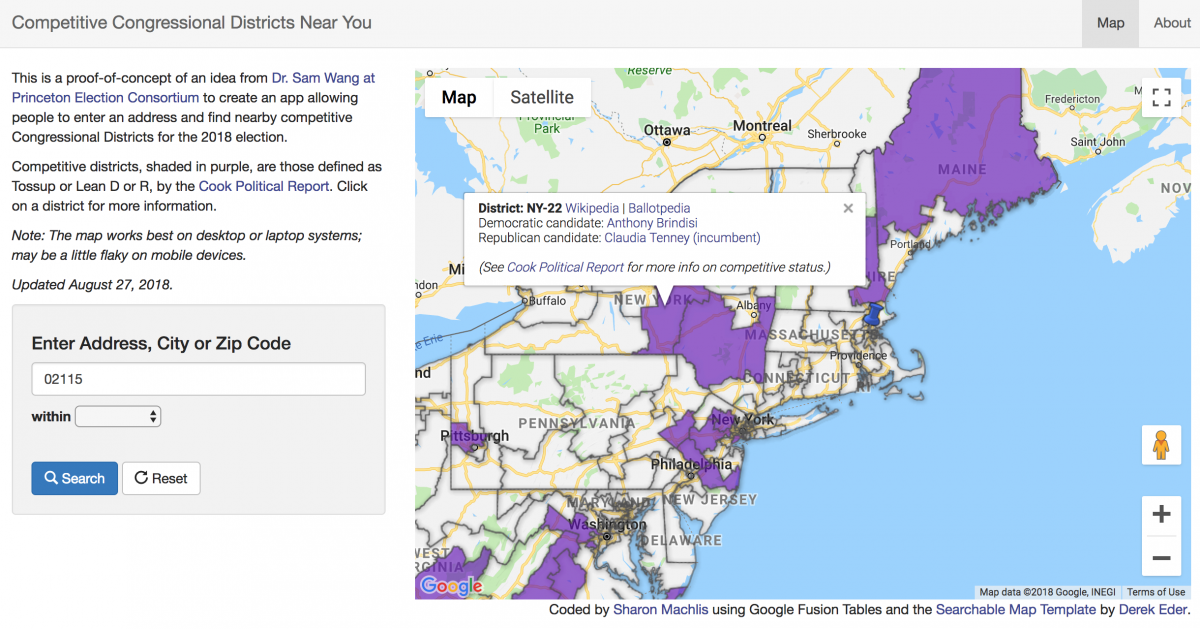
Find your closest contested election
A prototype map from Princeton’s Sam Wang and Sharon Machlis uses Cook Political Report data and asks for a zip code or address to bring you your closest hotly-debated elections.
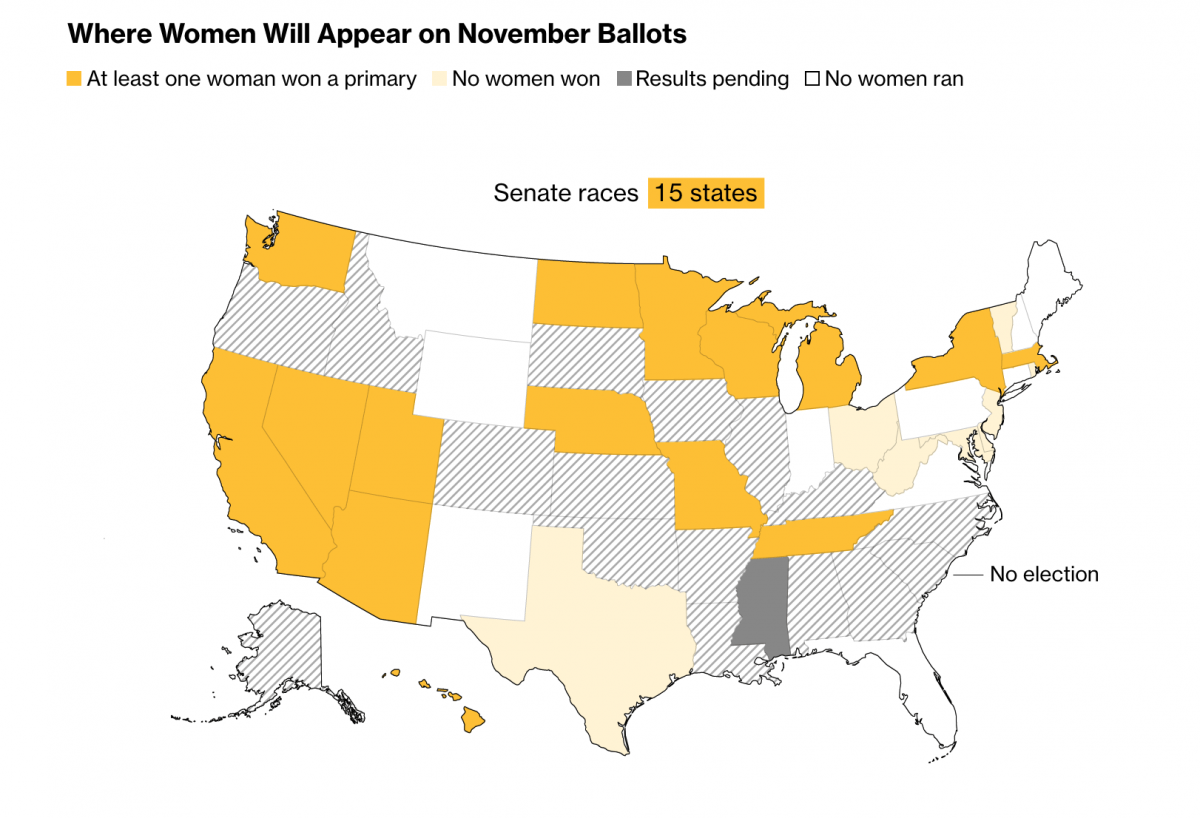
Where women are running
Democrats “outnumber female Republican nominees by better than 3-to-1,” according to a recent Bloomberg piece featuring a whole lot of maps.
Midterm power rankings
Fox News has an interactive map of the midterms.

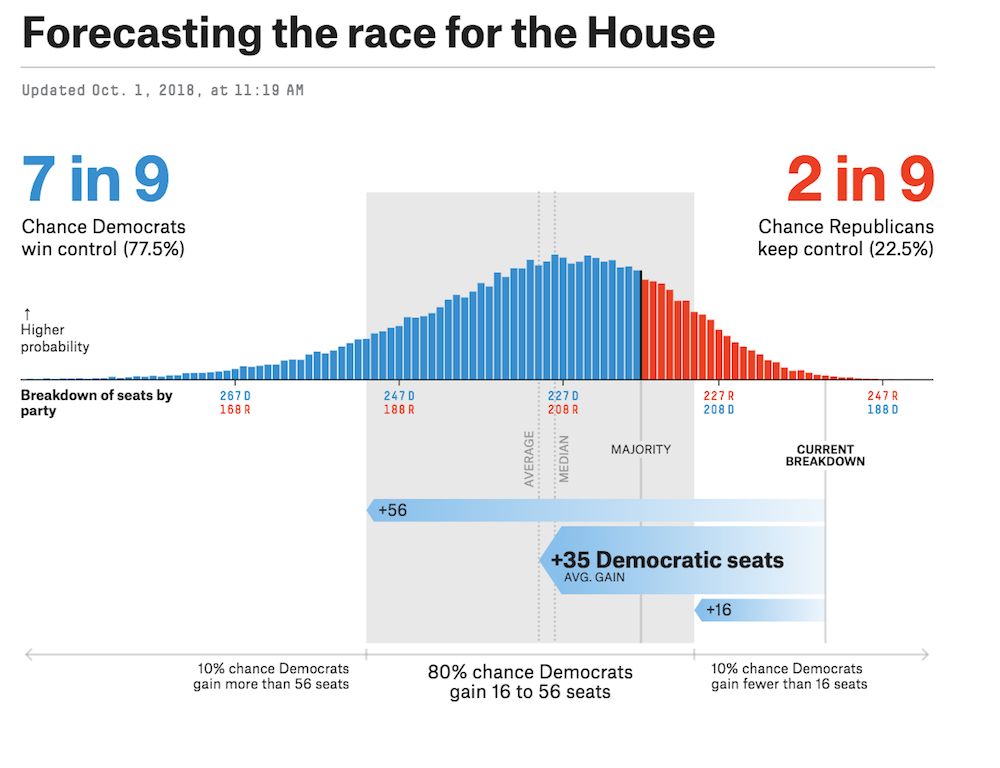
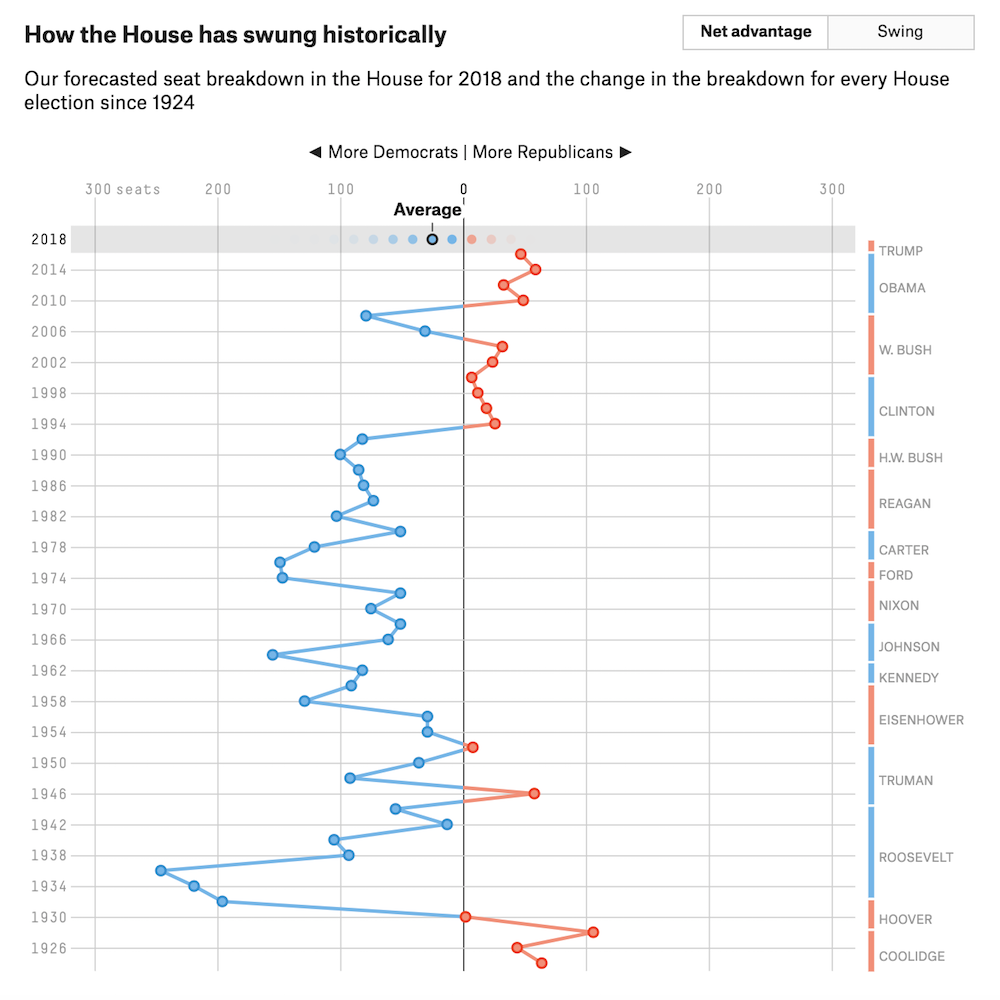
FiveThirtyEight’s forecasts
Wielding clever code and slick design, FiveThirtyEight forecasts the races based on data from founder Nate Silver. Listen to the “Model Talk” installments of their Politics podcast for a sense of what goes into the statistical model, which Silver builds with STATA.
Visualizing voter enthusiasm
As mentioned above, these midterms seem to be attracting a surge of voters, according to Pew.
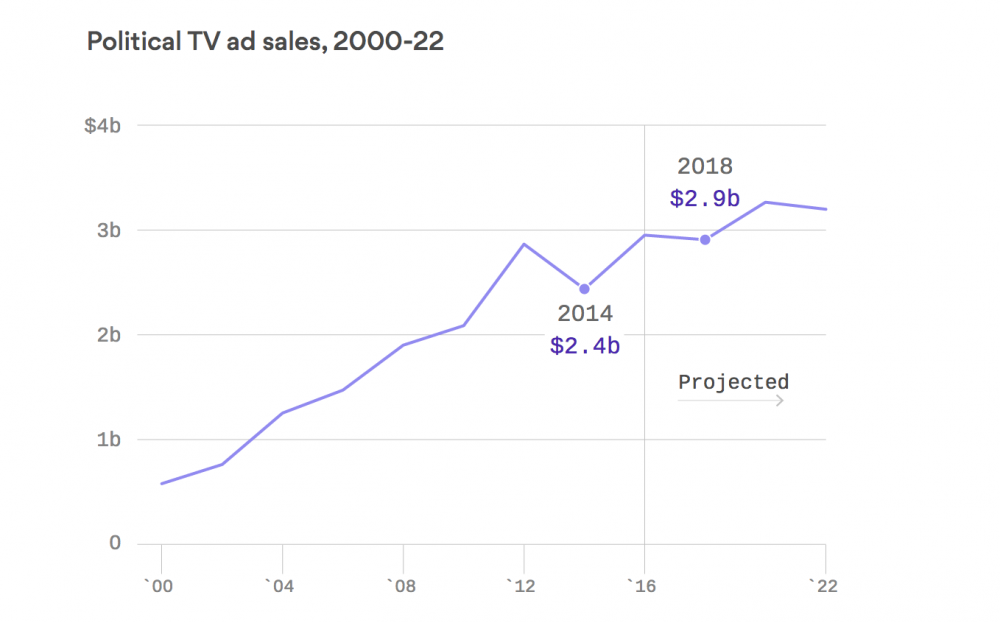
Midterm spending that rivals presidential election years
Axios notes that while the future is digital, “television is still king” when it comes to political advertisements. And there’s no shortage of dollars going into those ads.
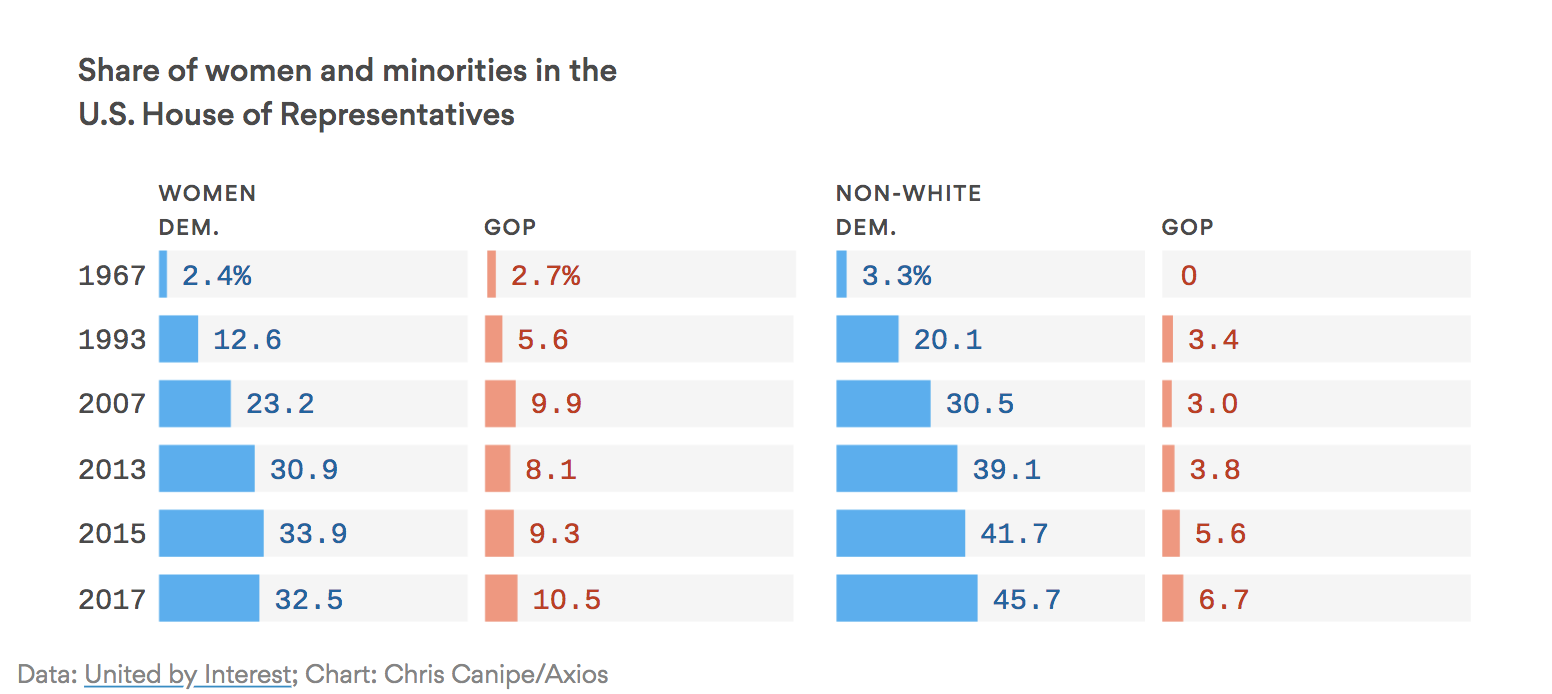
The 2019 Congress could break diversity records
Will the make-up of Congress finally start to look like the make-up of the nation? Doubtful. But it’s inching closer, according to Axios’s charts depicting the steady rise of minority candidates.
After voting on Nov. 6, Storybench will be sure to round up different techniques used to visualize the results.
- How The Pudding visualized the structure of Ali Wong’s stand-up comedy - February 7, 2019
- “The Immigration Experience” humanizes the history of immigration law. Here’s how. - November 9, 2018
- Behind the scenes with Galen Druke and FiveThirtyEight’s Politics podcast - October 30, 2018