How The New York Times proposed fixing NYC’s subway using 3D models and visuals
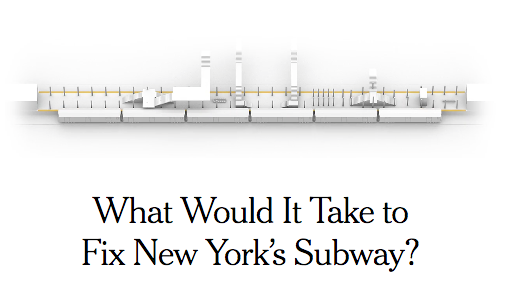
It’s no news that the New York City subway is overcrowded, beset by delays and runs on a frustrating fare collection system. Sergio Peçanha, a graphics editor for The New York Times recently published an article on how to fix the subway system in New York. He and his colleagues have come up with six suggestions – presented visually – for how New York could solve some of these problems.
Peçanha spoke with Storybench about the birth of the story, the tools used and the challenges he and his team faced while working on this piece.
How did you come up with the idea for the story?
We have been looking at different angles for the subway story, visually-driven angles because the subway here is in crisis for a bunch of reasons and we just wanted an angle that was mainly visual to get into it.
What kind of software or applications were required for this piece in illustrating the new designs for the subway?
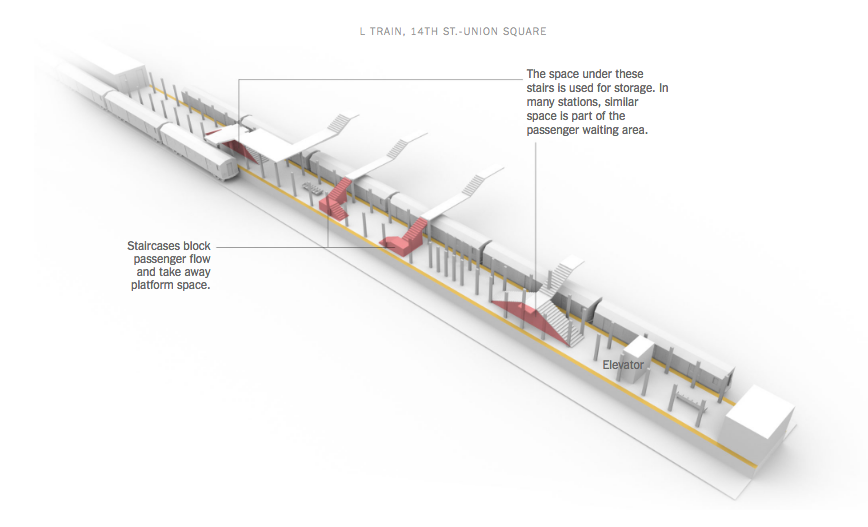
The diagrams were done in 3D by a colleague of mine, Anjali Singhvi, and she used Maya for the renderings and I believe she used SketchUp for when she was creating the models. She and I visited the stations that she had diagrammed a few times and we measured it ourselves and she went there and she recorded some video that she used as reference. We took a lot of photos. She spent a good amount of time registering the details of the station so it could be accurate. We had to do our own research.
The programs that we used, we used Illustrator, she used Maya, SketchUp, we used some Photoshop for this one. To put the page online, there was CSS and HTML. Our files, the way we work, it’s integrated through something that is powered by Google docs and some Javascript that calls the doc.
Did you get blueprints for the subway system?
We did not get the blueprints from the MTA. They weren’t particularly helpful in general with this story and they said specifically that they couldn’t share the information because of security concerns, but we were able to go to the stations as they are all public spaces and with using photographs and measuring things, like the sizes of tiles, we were able to get a very close estimate to the [actual] dimensions [of the stations].
How did you collaborate with others on this article? What were their roles?
Anjali did all of the drawings really. Mika helped out with a few renderings but she did the work, the research and everything, so it’s mostly her. A lot of the work we do is done in collaboration and we have a pretty large team and it’s important that people work together well because we work together all the time.
The way we worked on this piece specifically was I was responsible for collecting the content that we used, so I did all the reporting and I did a lot of the sketching for the diagrams. But then Anjali went back on her own [to the subway stations] and I went back on my own and we shared photos and sketches and measurements and we also consulted with other sources like things available online or material from people we spoke with and then she made all the models, the 3D models based on this information. I checked the models later and matched it with what I had seen. I made the annotations on the model.
What was your process in designing this article so that it was easier for the audience to understand and make sense of it?
“I tried to keep my writing to a minimum and to let the images speak as much as I can.”
We start all of our projects mostly with research and trying to understand the problem. We talked to specialists who understand the subjects. In this case, I spoke with several people and they told me different things about it and I didn’t really know anything about the subway, I mean, only what I know as a rider and I wouldn’t understand how the system works very well.
I had several conversations with a bunch of experts explaining these things to me. From those conversations, I made a Google doc in which I had an outline of the story, then I divided it into about five or six categories, then I refined it and then I tried to limit the number of words that I would use. I tried to keep my writing to a minimum and to let the images speak as much as I can.
Some of those segments are naturally more visual like how you can change the design of stations to make the subway work better, so I prioritized those at the top of the story to ensure that the story would be mainly visual and I limited the others to whatever was the extent of reach to understand it.
How did you embed the illustrations into the story?
HTML, CSS and Javascript. We have a system here [at The Times], the drawings, most of them, not all of them were done in 3D and then they are brought into illustrator and then we have one script that’s called, ai2html, that you can access online and that turns the newswire file into an html file. We have one bigger page that is powered by Google docs and that page calls one of the little files of html and those are the graphics you see in the article. That’s it really. We work in Google docs so we can all share between me and whoever is editing the story or working with me.
There are some photos in the article of electromechanical relays and the room where they monitor all the trains, what was the process to get those photos?
In this case, it wasn’t the normal process. Normally, what we would do is ask the photo editor to assign a photographer for that story and give them some time and then they go collect the images. Another option is we could go ourselves and collect photos or videos and another one is, which I ended up using in this case, is we can just use some photos from our archives. So, in this case, I was hoping to get access to the subway system but I wasn’t able to and some of our photographers already had access to the pictures we wanted so I ended up just using the photos we had in the archive.
Anything that you would like to mention about the article? Something that stands out, something that is more behind-the-scenes that you would like people to know about?
Well one thing is that this was originally meant to be a multimedia piece but because we didn’t have as much access as we had wished, we had to find different solutions. So that justifies that the different photos that you have, the way they are. I wanted to collect videos, I wanted to do it differently but it wasn’t so easy to get access to the behind-the-scenes at the MTA this time.
What advice would you give to other journalists who were trying to do similar visual stories?
I think it’s important if you’re trying to make visually-driven stories that you think of visual approaches to those stories. If in your approach to begin with, the questions you try to answer are intrinsically visual, I think that increases the likelihood that you’re gonna come out with a visual story.
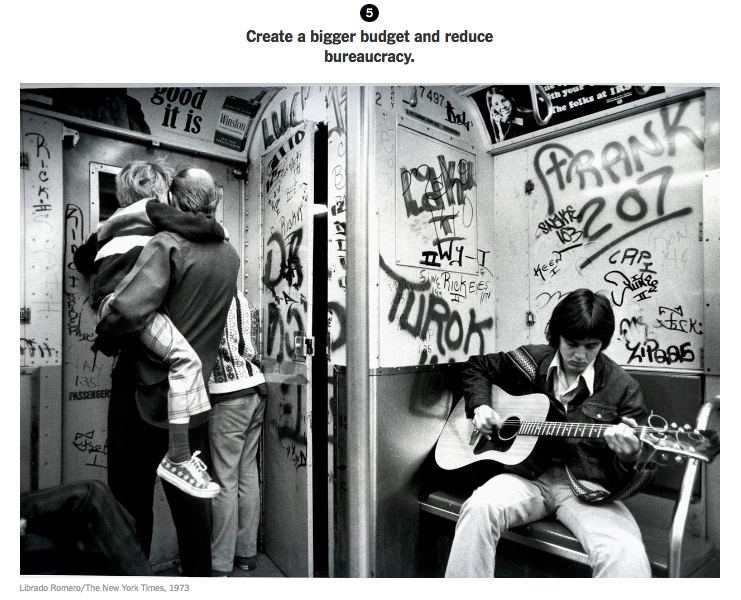
So, for example, if you look at this article, it breaks down five main things that would make a big difference to essentially improve the subway. One of the things according to the experts that I could not ignore is that the subway needs to change the way it relates with the [public transit] union. So, for that, I spoke to somebody in the union, and one of the people from the RPA. Essentially, I had to write this part down. It was word-driven. But the part about how to improve platforms, that is something visual because then you can show the problems with the flow of people on the platforms, the design changes, the comparisons with the parts of the system that work, so that is a visual element. I tried in this case to emphasize what was more visual. So I think one advice is, look for stories that are visually-driven.
- How The New York Times proposed fixing NYC’s subway using 3D models and visuals - February 28, 2018


