How the Wall Street Journal made the College Board’s adversity scores interactive
The world of higher education reporting got more than its share of news coverage in 2019. Actress Felicity Huffman was sentenced to two weeks in jail for paying Rick Singer, the admissions scheme mastermind, $15,000 to boost her child’s SAT scores.
Amid the flurry of discussions over the many cases that came out of Singer’s scheme, the Wall Street Journal’s Doug Belkin looked into other ways that people might take advantage of the college admission process, which eventually led him to a deeper look at the College Board’s adversity scores. These scores take 15 different social and economic factors into account to produce one number. A score of 10 or below would be a school that faces almost no adversity, whereas one that has a score of 90 or above is facing the most adversity.
Storybench spoke with Belkin and graphic designer Elbert Wang to discuss the interactive charts that break down the adversity score, and the story that progressed along with them.
Note: Storybench interviewed Belkin and Wang at different times, therefore some questions have been edited for clarity.
I noticed that the article says that it was updated in November. When did you originally publish and how did this story unfold?
Belkin: I got a leak that got the data that was sent to me. We put just the score of the school, the adversity score of the school, online. First we wrote a story that said that the College Board had an adversity score, and there was a lot of pushback after that story and people claimed that [the adversity score] was racist, essentially. The College Board dropped the adversity score — they didn’t actually drop it, they just sort of renamed it. They took away the adversity score, but they divided it into two different numbers. When we wrote that story in August, we published … the scores for the high schools, which was when we had the data. Then we did the analysis in November.
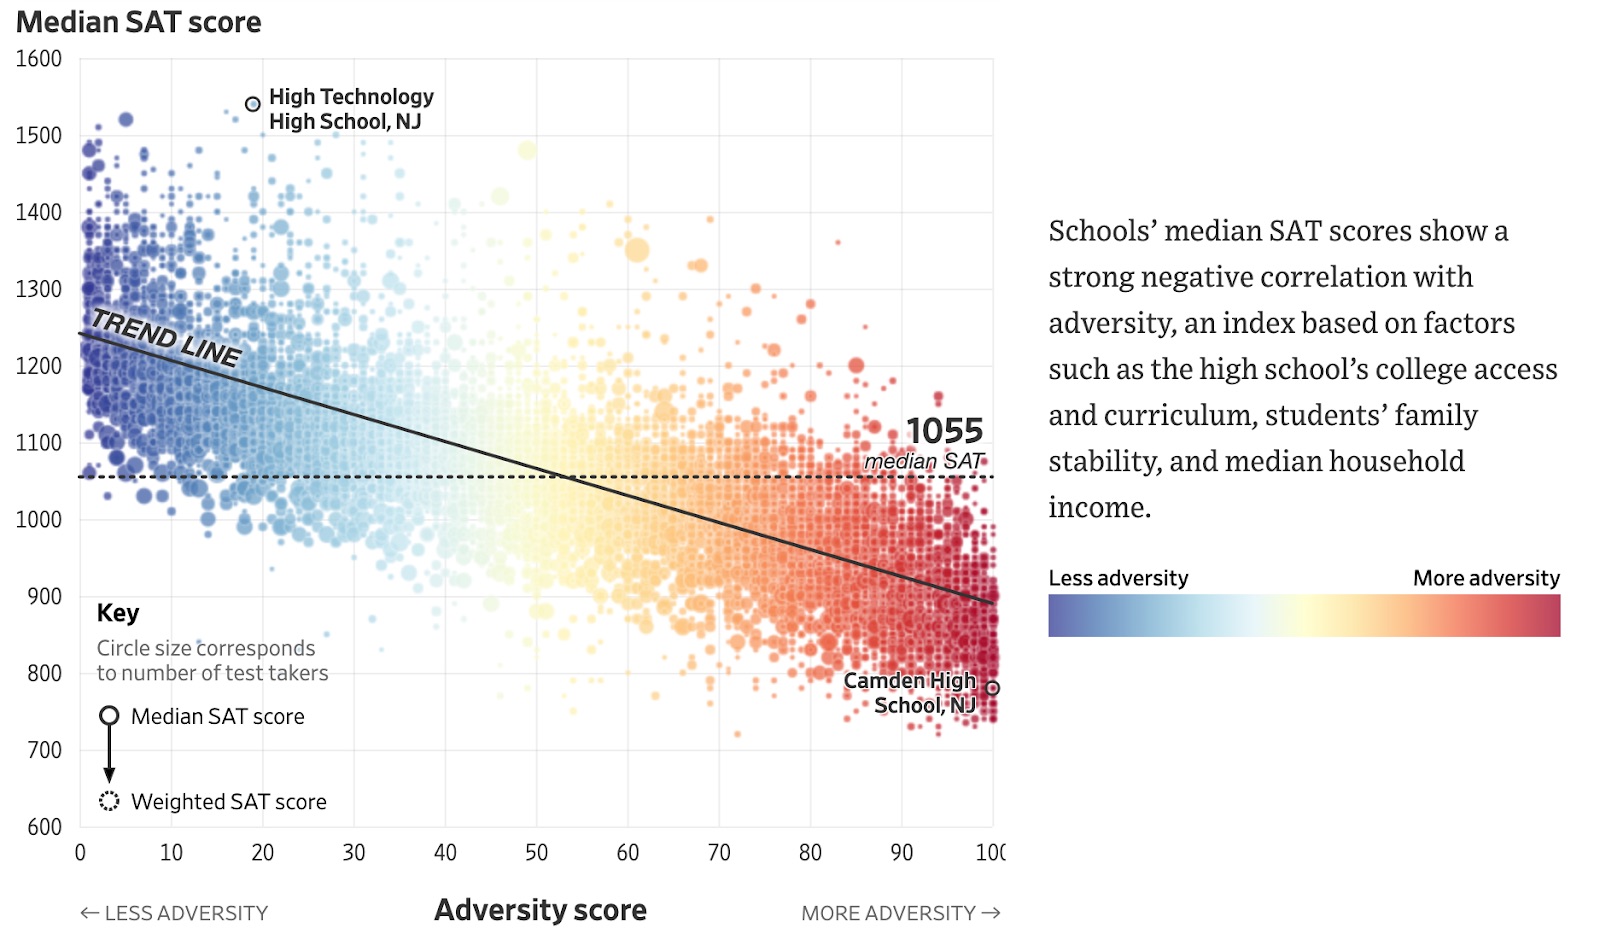
Wang: We wanted to use [the data] somehow, even though we knew that the College Board was no longer using the adversity scores. But it still kind of provides an interesting look at how adversity scores affect or are correlated with SAT scores. And so, I think the natural pick for the data was a scatter plot because it shows the correlation. And when we plotted out the data, just like when we were prototyping it, and it was very clear. And so we kind of tried to slice and dice the data in different ways to show and help guide the reader through the chart.
So you didn’t have to compile all the data by hand, it was compiled when you received it?
Belkin: No, you can’t compile this data by hand … A lot of the data in there is proprietary. Even if we had the individual data points that went into the adversity score, the weights that … were used to determine the actual score from all these different data points were not revealed. So we couldn’t have done this ourselves. It wasn’t possible. It didn’t come from the College Board. It came from someone directly. I got a source who could leak … to us. So we couldn’t build this ourselves. And part of this, part of the reason why I think the adversity score was so interesting to people, is because no one knew what theirs was. And that’s troubling to a lot of people.
Did you decide how to visualize that data or did you hand it over and allow Elbert to make those decisions? Or was it a joint process?
Belkin: No, I gave him the data and … then he showed me what he did, and my jaw hit the floor. He’s so talented, and I think the graphics are so beautiful and that was all him. I don’t even know how he did it. So I think he’s a magician. I think that those graphics are just, it’s funny, they’re not only informative and eye-catching, but they’re aesthetically beautiful. So I was really pleased to be just associated with his work. And the fact that they’re interactive and you can put in your own school. And I’ll tell you, the time people spent on the story was very long, and a lot of that was driven by people playing with the interactive. So it worked.
Elbert, how did you decide to visualize the data?
Wang: I feel like readers may not always understand different chart types. It feels very clear to me what the data is showing, but I think for readers, you want to kind of label the data or label the chart to be very clear exactly what we’re showing. And in the article we kind of walk through, like, “This part is high adversity, this part is low adversity.” So I think we were just very explicit with what we wanted to show. Hopefully, that kind of helped the reader understand what we wanted to tell using the data. And I think also, kind of providing like a tooltip and a look-up, kind of helps the reader understand what their high school adversity score is, what was their high school’s median SAT score is. So that kind of helps place the reader in the data.
What made you decide to write this story?
Belkin: So what happened at the Journal with our education coverage this year was that everything kind of got reshuffled after the Rick Singer case blew up. We had two reporters who were covering … the case and tracking down the client and the people who were going to get a court date and Singer himself. So there’s a huge amount of work to follow the bouncing ball about how that unraveled and stuff. Melissa Korn, who covers education in New York, and Jennifer Levitz, who’s a general assignment reporter in Boston, were there for the initial press conference for the U.S. Attorney’s office analysis of the case. What I was doing really was looking more broadly at admissions. And so, Singer raised the point … that wealthy people were able to take advantage, in some ways illegally, of the admissions process.
What I really spent the year doing is asking the question, “What are the other advantages inherent in college admissions?” That led me to a lot of different stories, including an examination of the College Board and how it works. The number of kids who get extra time on the test is very much skewed towards wealthy students. They have the means to get tested to show that they have ADHD and things. And so we did a story in May that was an examination using data around that issue. And then I was just reading up on the College Board and I found the adversity score, the adversity score had been in place for a couple of years. They’ve been rolling it out, but it hadn’t been reported on outside of … the College Board’s website. And then David Coleman, the head of the College Board, had written about it in a column for Inside Higher Ed.
So even though it was essentially two years old, when I was able to frame it in this new application idea, then people were very interested in it. Most folks hadn’t seen it before. So that adversity score that we wrote about, I think in May or June, led to eventually this leak of this data that generated out of this stuff, the information that ended up in Elbert’s capable hands and we ended up with a story.
How do you feel about the backlash that the College Board faced and their decision to stop providing adversity scores?
Belkin: Well, they’re in a really tough spot. There’s so much pressure on colleges because the demography of the country is changing so quickly, and these scores are so out of step with the access agenda that is being pushed at universities. And you know, there’s good reason for that. And there’s an argument to be made for these standardized tests, but they just don’t line up. That disconnect is contentious, so the College Board is in a difficult spot, the universities are in a difficult spot, the kids are in a difficult spot, which is what makes this all a fascinating story. Because this is woven into the fabric of college admissions now, but it’s becoming untenable.
Wang: I think I understand why the “adversity score” exists. I think the graphic makes it pretty clear, that … SAT scores don’t kind of exist in a vacuum. There are factors that affect the score. I think just the way that it was framed was a little poor. And I also understand why people got really mad about it. I understand both sides. And I feel like it’s probably very difficult for the College Board to kind of justify why this score exists. But I think that they’re using it. They’re basically calling it a different name, I think, but they’re probably kind of sticking to it.
Have you seen the new way that they are putting these scores in front of colleges?
Belkin: I think they call it Landscape. So the way it works, as far as I understand it, hopefully, they didn’t change it in the last month and I missed it but, the adversity score … takes a lot of socioeconomic data from neighborhoods and it gives a neighborhood score, and then it takes another set of data — socioeconomic and academic data from the schools — and it combines those two numbers into one number that they call the adversity score. What the landscape does is it doesn’t combine the scores — they give you a neighborhood adversity score and a school adversity score. But because it’s not one adversity score, they’ve rebranded it. This is their answer to avoiding the backlash they were getting from, essentially, folks who [perceived being] hurt by having a low adversity score, which is [often] wealthy white kids, mostly, so… they said it was threading the needle around the issue. By presenting the majority [of] the same information but with a different name.
What was the overall takeaway that you wanted readers to get?
Belkin: Where you’re born in this country dictates a lot of your opportunities and your chances. And if you’re born into a high school … with adversity scores in the 90s and the median SAT is in the 800s, it’s very different from being born into a place where the adversity score is in the single digits and the average SATs are in the 1300s. And people I think look at the SAT and think it’s a raw measure of intellectual horsepower, and that’s not true. I think this data shows that very clearly.
Wang: Basically the extent to which your socioeconomic status and environmental factors affect how you score [on the SAT]. And the factors are out of your control. There are still some schools that perform above what their adversity score would predict, and some that perform below. But in general, it follows a very clear trend, and it kind of shows that [although] the SATs are a standardized test … people are starting from an unequal playing field.


